SNMP
The SNMP Exporter turns SNMP polling results into Prometheus metrics for any device that exposes SNMP OIDs: routers, switches, printers.
Pattern: SNMP Exporter → Prometheus scrape → xScaler remote_write
Dashboards
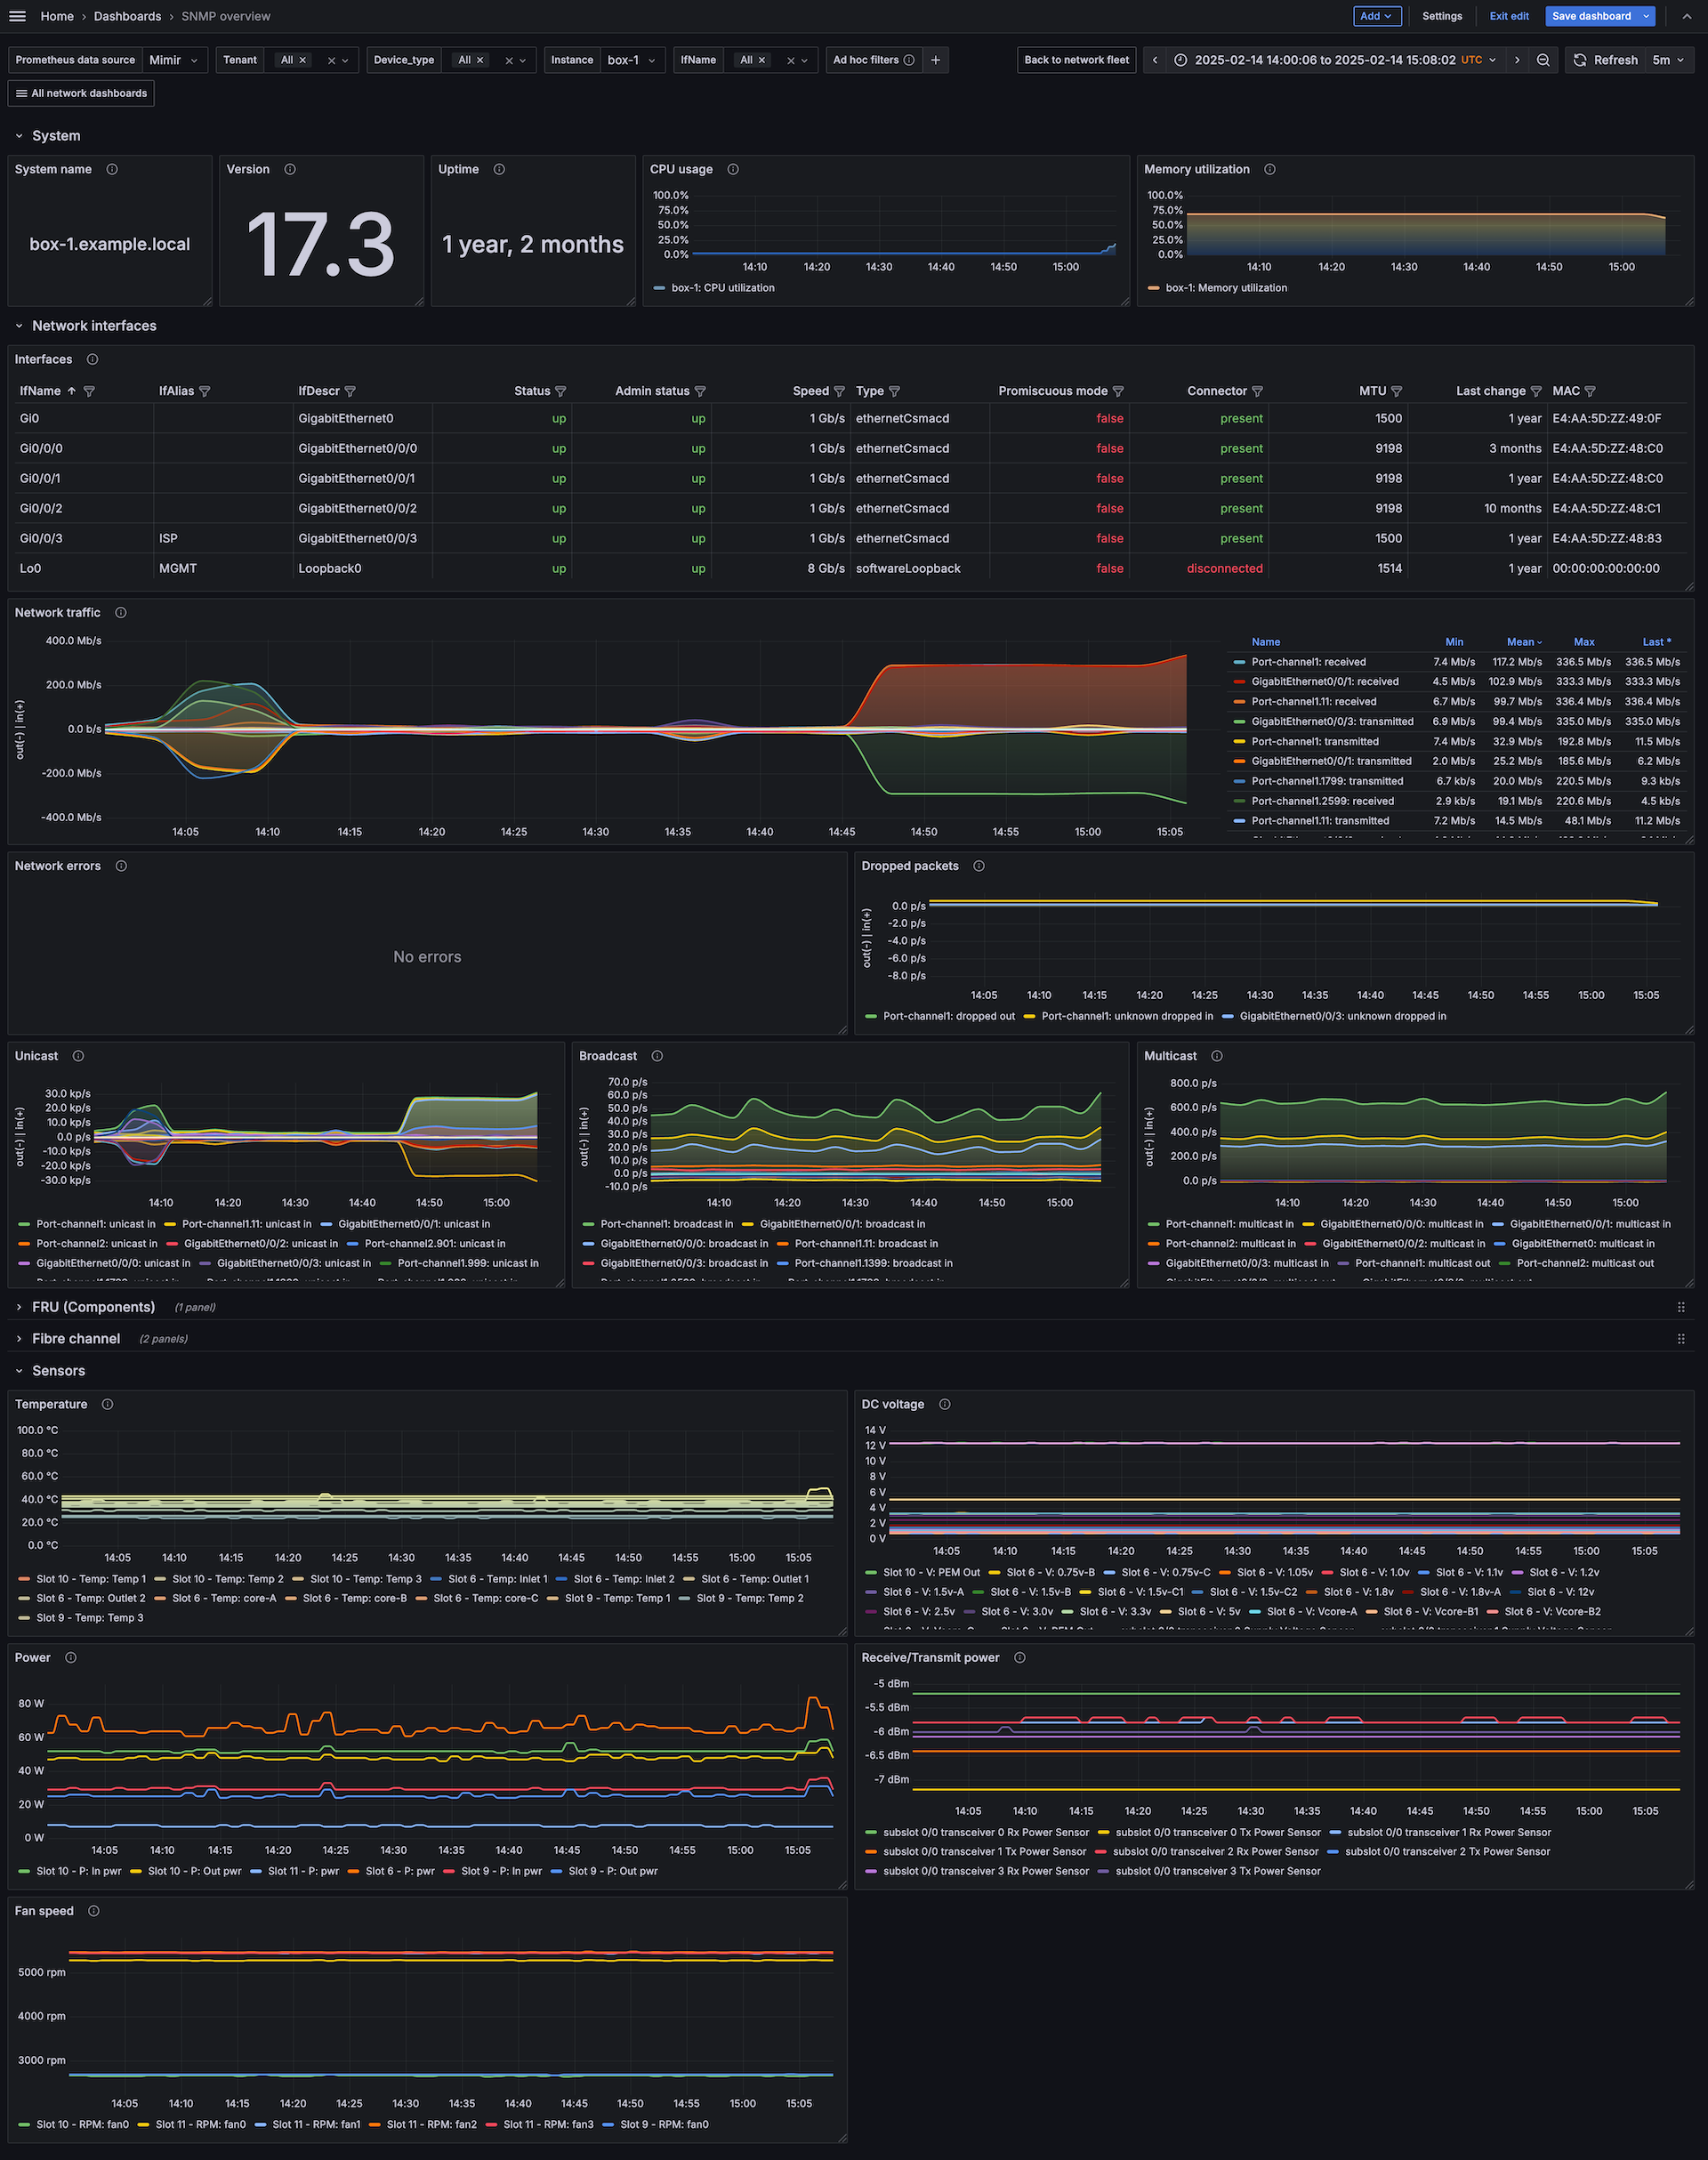
SNMP Overview
Device-level SNMP metrics including interface traffic, error rates, and system uptime.
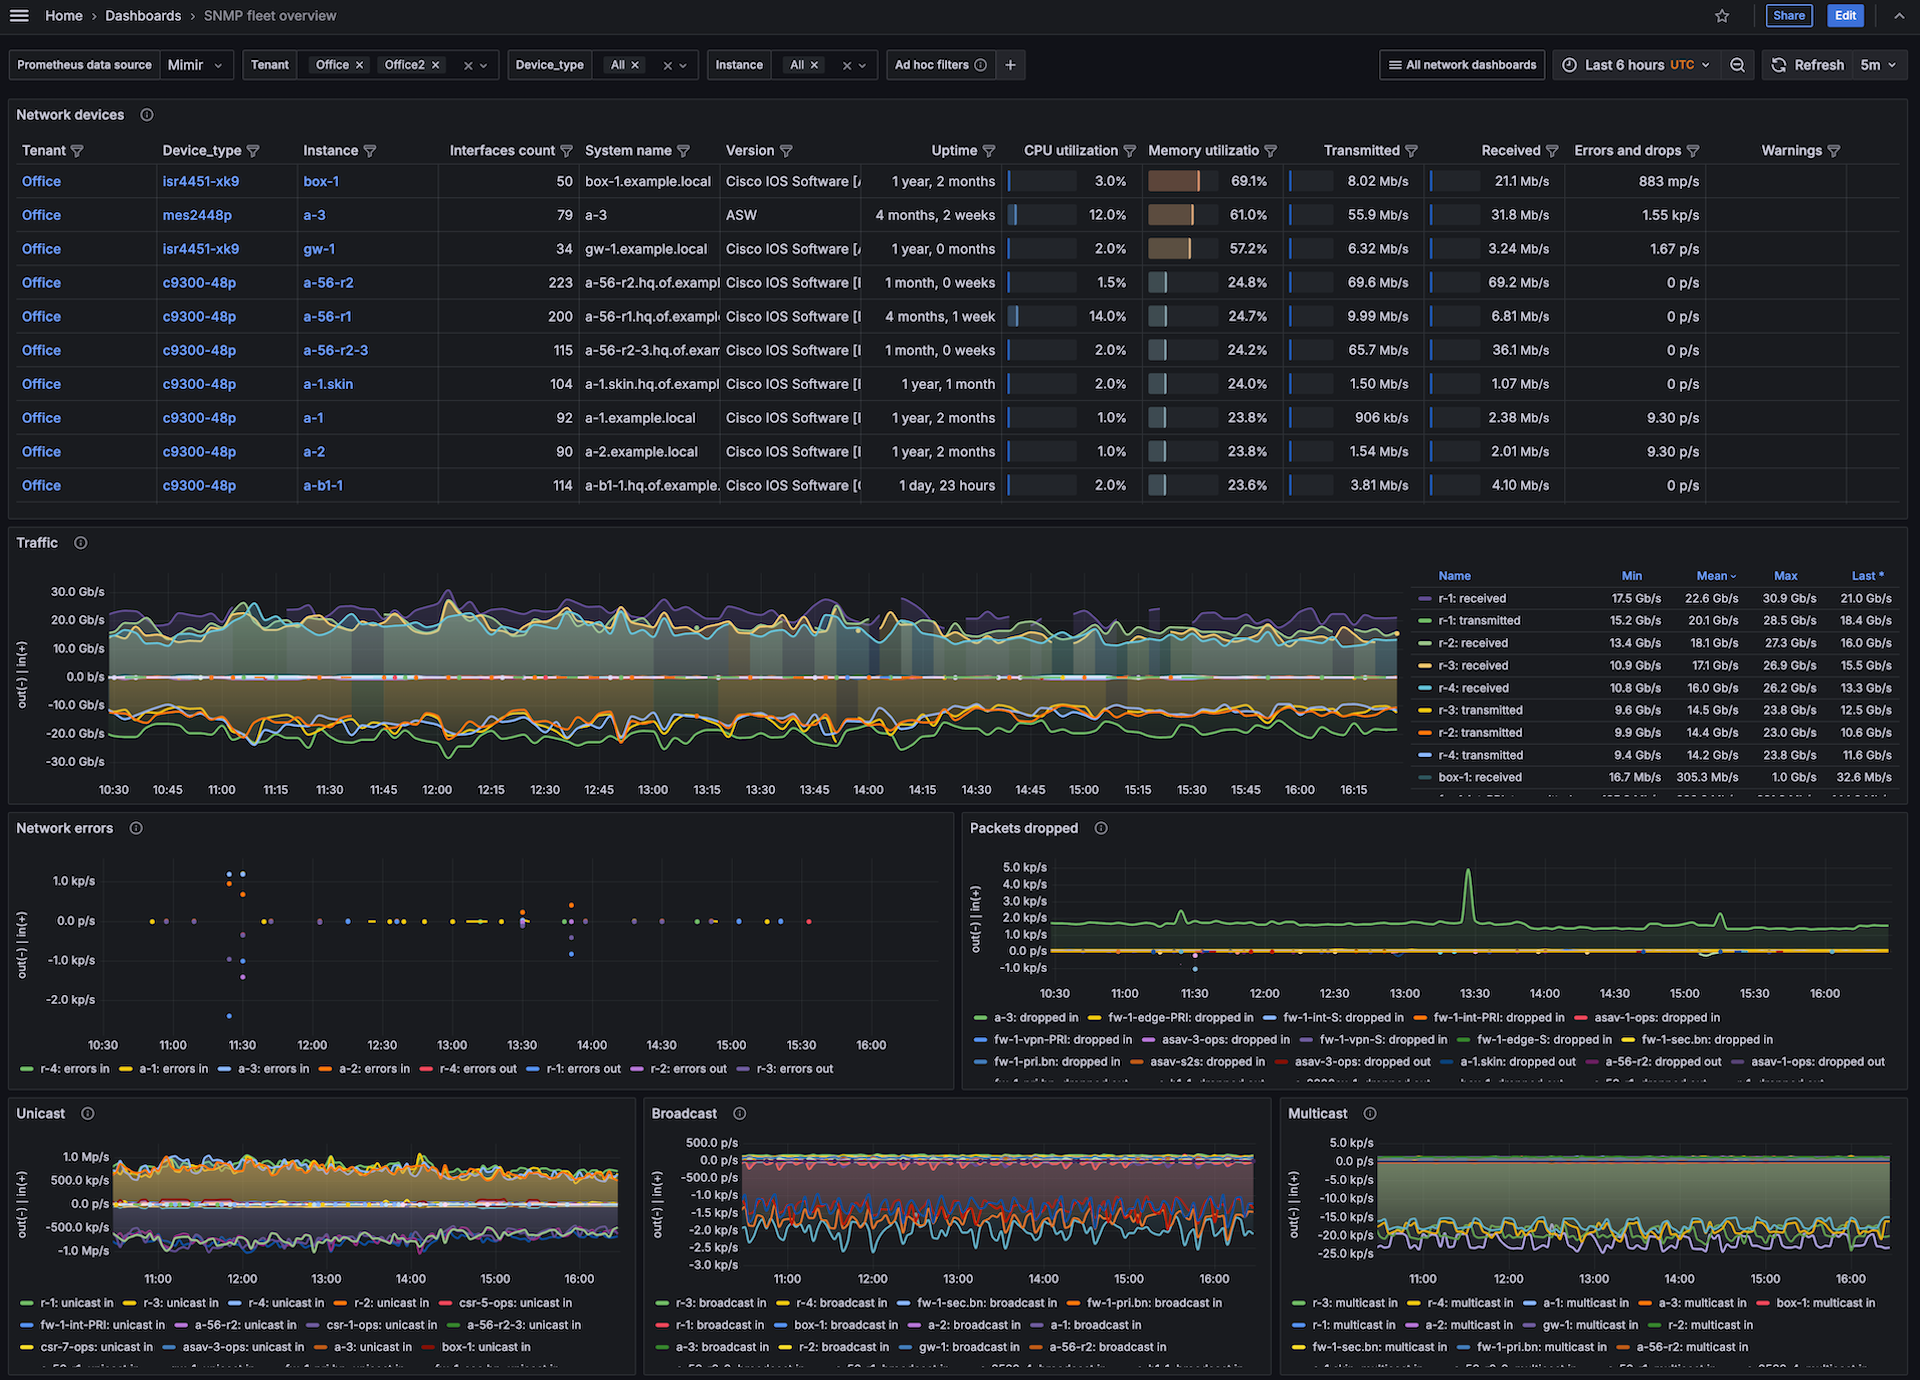
SNMP Fleet
Fleet-wide view across multiple SNMP-monitored devices.
Prerequisites
- Network devices reachable via SNMP v1/v2c/v3
snmp_exporterbinary (GitHub)- A
snmp.ymlfile generated with thegeneratortool for your target MIBs - xScaler remote_write credentials (Bearer token + tenant ID)
Option A: Prometheus Exporter
1. Generate snmp.yml for your MIBs
git clone https://github.com/prometheus/snmp_exporter
cd snmp_exporter/generator
# edit generator.yml to list the MIBs you need
make generate
cp snmp.yml /etc/snmp_exporter/
2. Start snmp_exporter
snmp_exporter \
  --config.file=/etc/snmp_exporter/snmp.yml \
  --web.listen-address=0.0.0.0:9116
3. Configure Prometheus with target parameter
scrape_configs:
  - job_name: snmp
    static_configs:
      - targets:
          - 192.168.1.1   # device IP
          - 192.168.1.2
    metrics_path: /snmp
    params:
      module: [if_mib]
    relabel_configs:
      - source_labels: [__address__]
        target_label: __param_target
      - source_labels: [__param_target]
        target_label: instance
      - target_label: __address__
        replacement: localhost:9116

remote_write:
  - url: https://euw1-01.m.xscalerlabs.com/api/v1/push
    authorization:
      credentials: <token>
    headers:
      X-Scope-OrgID: <tenant-id>
Option B: Grafana Alloy
prometheus.scrape "snmp" {
  targets = [
    { "__address__" = "localhost:9116", "__param_target" = "192.168.1.1", "__param_module" = "if_mib" },
    { "__address__" = "localhost:9116", "__param_target" = "192.168.1.2", "__param_module" = "if_mib" },
  ]
  metrics_path = "/snmp"
  forward_to   = [prometheus.remote_write.xscaler.receiver]
}

prometheus.remote_write "xscaler" {
  endpoint {
    url = "https://euw1-01.m.xscalerlabs.com/api/v1/push"
    authorization {
      type        = "Bearer"
      credentials = "<token>"
    }
    headers = { "X-Scope-OrgID" = "<tenant-id>" }
  }
}
Option C: OpenTelemetry Collector
receivers:
  snmp:
    collection_interval: 60s
    target_address: udp://192.168.1.1:161
    target_name: network-device
    version: v2c
    community: public
    oids:
      - name: ifInOctets
        oid: "1.3.6.1.2.1.2.2.1.10"
        metric_type: gauge
      - name: ifOutOctets
        oid: "1.3.6.1.2.1.2.2.1.16"
        metric_type: gauge

processors:
  memory_limiter:
    check_interval: 1s
    limit_mib: 256
  batch:
    timeout: 10s

exporters:
  otlphttp/xscaler:
    endpoint: https://euw1-01.m.xscalerlabs.com
    headers:
      Authorization: "Bearer <token>"
      X-Scope-OrgID: "<tenant-id>"
    compression: gzip

service:
  pipelines:
    metrics:
      receivers: [snmp]
      processors: [memory_limiter, batch]
      exporters: [otlphttp/xscaler]
Logs
Collect snmp_exporter log via systemd journal. Add the following to your Alloy config:
loki.source.journal "snmp_journal" {
  forward_to    = [loki.write.xscaler.receiver]
  relabel_rules = loki.relabel.snmp_journal.rules
  labels = {
    job      = "integrations/snmp",
    instance = constants.hostname,
  }
}

loki.relabel "snmp_journal" {
  forward_to = []
  rule {
    source_labels = ["__journal__systemd_unit"]
    target_label  = "unit"
  }
}

loki.write "xscaler" {
  endpoint {
    url = "https://euw1-01.l.xscalerlabs.com/api/v1/push"

    http_client_config {
      authorization {
        type        = "Bearer"
        credentials = env("XSCALER_TOKEN")
      }
    }

    headers = { "X-Scope-OrgID" = env("XSCALER_TENANT_ID") }
  }
}
Key metrics
| Metric | Description |
|---|---|
ifInOctets | Total bytes received on an interface |
ifOutOctets | Total bytes transmitted on an interface |
ifInErrors | Number of inbound packets with errors |
sysUpTime | Time since the device was last initialised |
ifOperStatus | Operational status of each interface (1=up, 2=down) |
hrProcessorLoad | CPU load percentage per processor |