Redis
Collect command throughput, memory usage, keyspace hit ratio, connected clients, and replication metrics from Redis using redis_exporter.
Pattern: redis_exporter → Prometheus scrape → xScaler remote_write
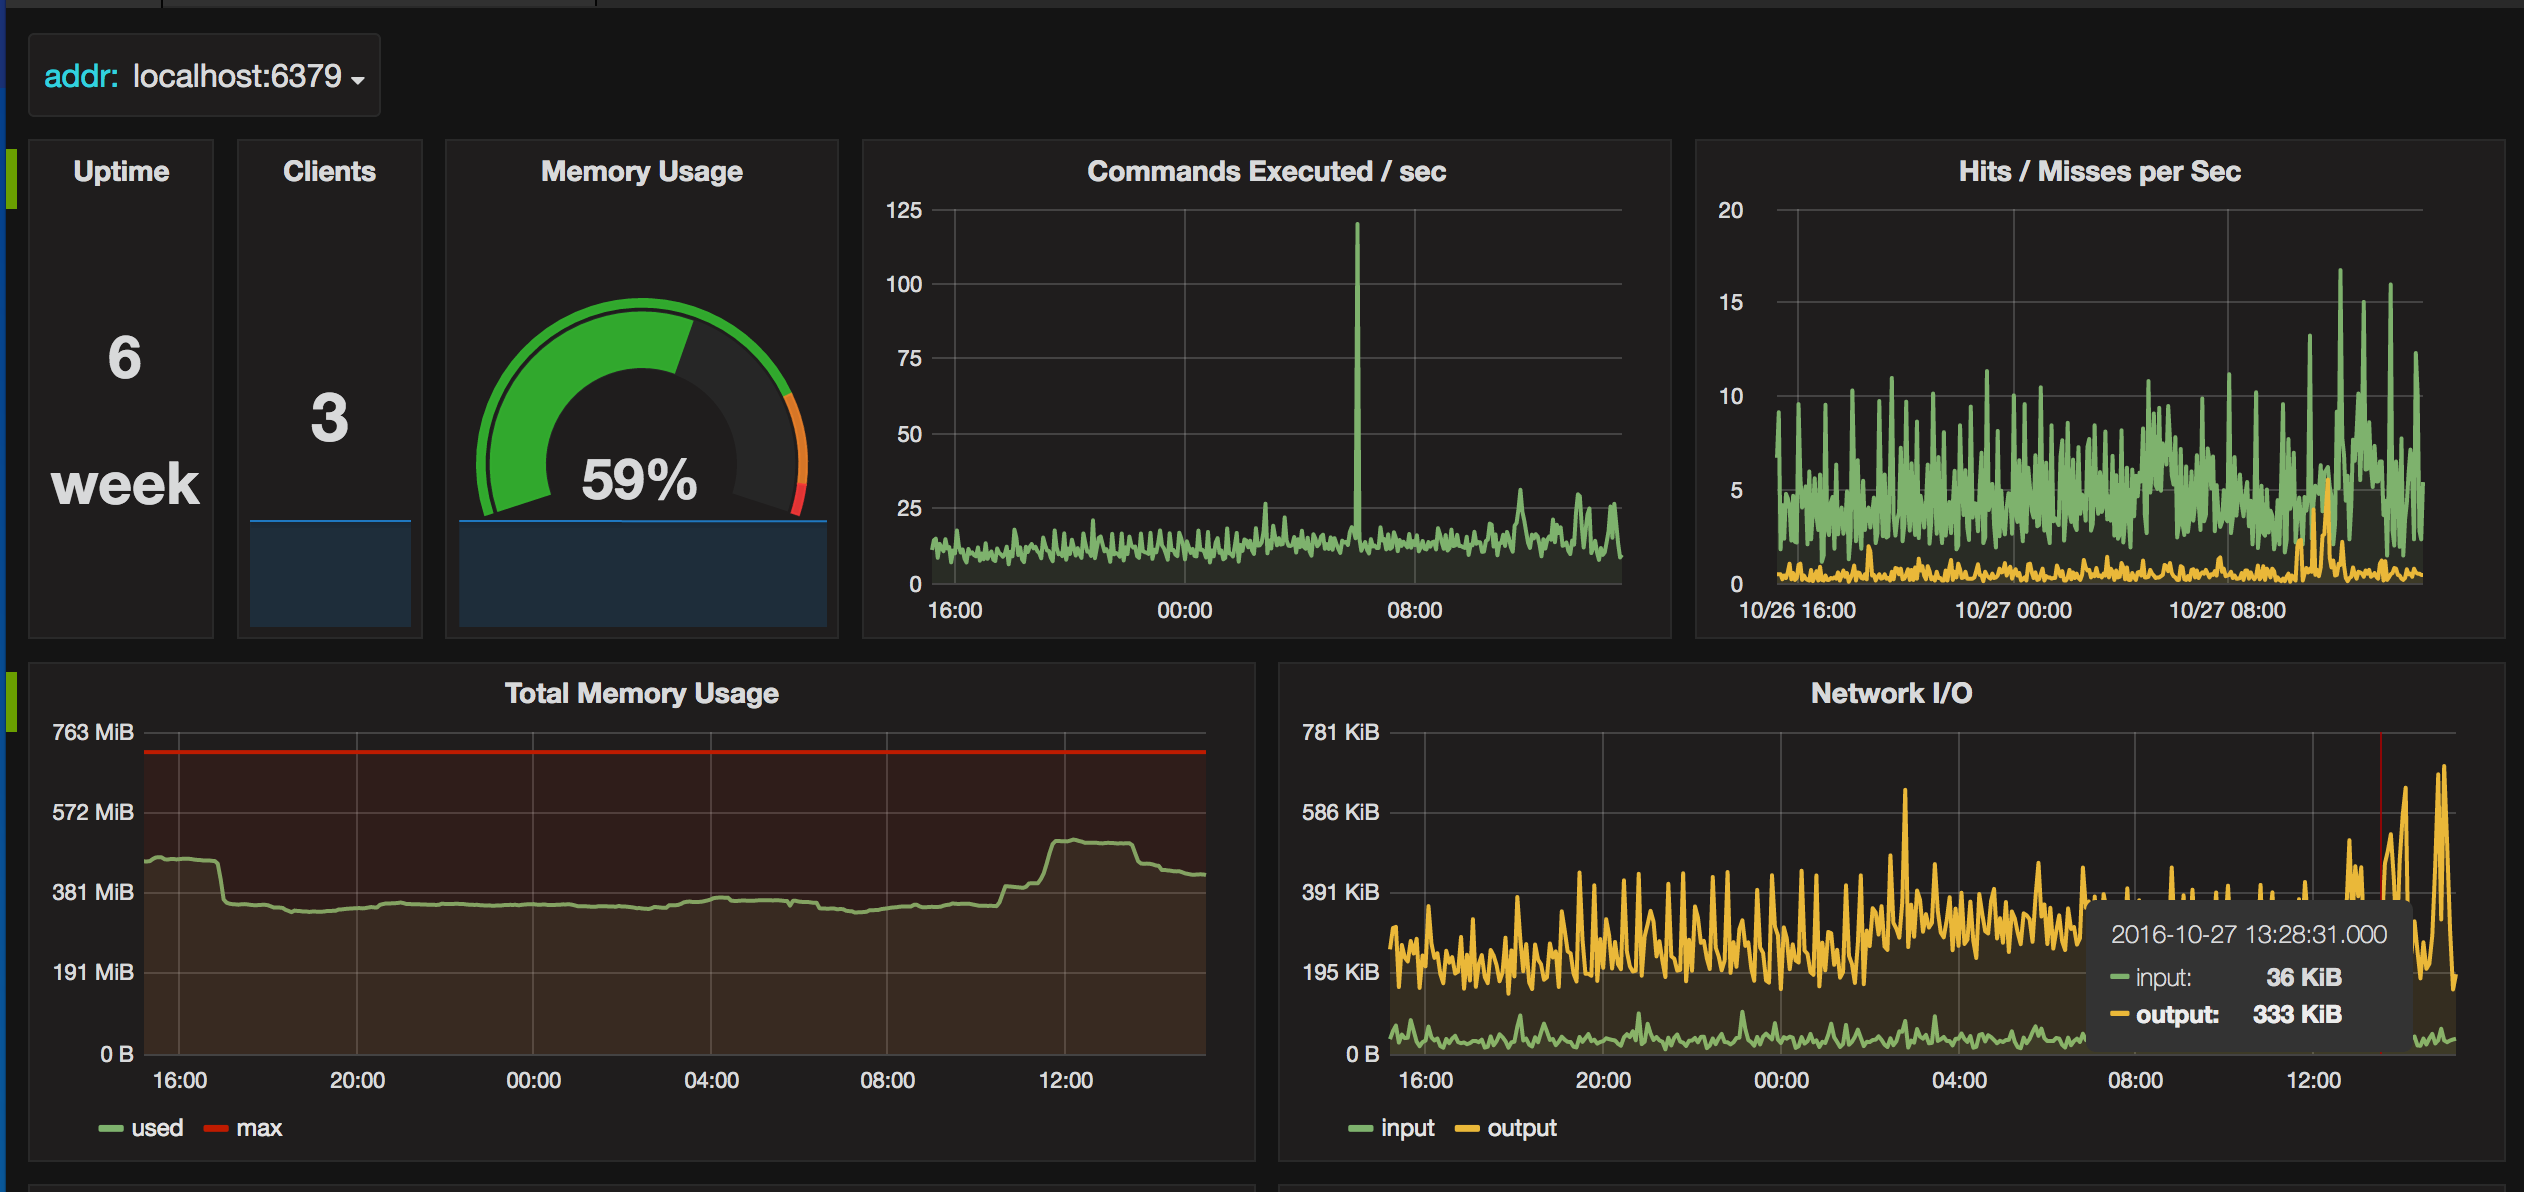
Dashboard
Prerequisites
- Redis 4.0 or later
- Prometheus or Grafana Alloy
- xScaler tenant credentials
Step 1: Run redis_exporter
No Redis configuration changes needed. The exporter calls INFO and CONFIG GET commands.
docker run --rm -d \
  --name redis-exporter \
  -p 9121:9121 \
  oliver006/redis_exporter \
  --redis.addr redis://localhost:6379
If Redis requires authentication:
docker run --rm -d \
  --name redis-exporter \
  -p 9121:9121 \
  -e REDIS_PASSWORD=yourpassword \
  oliver006/redis_exporter \
  --redis.addr redis://localhost:6379
Verify:
curl -s http://localhost:9121/metrics | grep redis_up
# redis_up 1
Step 2: Scrape and forward to xScaler
Prometheus
scrape_configs:
  - job_name: redis
    static_configs:
      - targets: ['localhost:9121']
        labels:
          instance: cache-primary

remote_write:
  - url: https://euw1-01.m.xscalerlabs.com/api/v1/push
    authorization:
      credentials: <token>
    headers:
      X-Scope-OrgID: <tenant-id>
Grafana Alloy
prometheus.scrape "redis" {
  targets    = [{"__address__" = "localhost:9121"}]
  forward_to = [prometheus.remote_write.xscaler.receiver]
}

prometheus.remote_write "xscaler" {
  endpoint {
    url = "https://euw1-01.m.xscalerlabs.com/api/v1/push"
    authorization {
      type        = "Bearer"
      credentials = "<token>"
    }
    headers = { "X-Scope-OrgID" = "<tenant-id>" }
  }
}
OpenTelemetry Collector
receivers:
  redis:
    endpoint: localhost:6379
    password: ""
    collection_interval: 15s
    tls:
      insecure: true

processors:
  memory_limiter:
    check_interval: 1s
    limit_mib: 256
  batch:
    timeout: 10s

exporters:
  otlphttp/xscaler:
    endpoint: https://euw1-01.m.xscalerlabs.com
    headers:
      Authorization: "Bearer <token>"
      X-Scope-OrgID: "<tenant-id>"

service:
  pipelines:
    metrics:
      receivers:  [redis]
      processors: [memory_limiter, batch]
      exporters:  [otlphttp/xscaler]
Logs
Collect Redis server log including connection events, warnings, and errors. Add the following to your Alloy config:
local.file_match "redis_logs" {
  path_targets = [{
    __address__ = "localhost",
    __path__    = "/var/log/redis/redis-server.log",
    instance    = constants.hostname,
    job         = "integrations/redis",
  }]
}

loki.source.file "redis_logs" {
  targets    = local.file_match.redis_logs.targets
  forward_to = [loki.write.xscaler.receiver]
}

loki.write "xscaler" {
  endpoint {
    url = "https://euw1-01.l.xscalerlabs.com/api/v1/push"

    http_client_config {
      authorization {
        type        = "Bearer"
        credentials = env("XSCALER_TOKEN")
      }
    }

    headers = { "X-Scope-OrgID" = env("XSCALER_TENANT_ID") }
  }
}
Key metrics
| Metric | Description |
|---|---|
redis_up | Exporter reachability (1 = up) |
redis_connected_clients | Connected client count |
redis_blocked_clients | Clients blocked on BLPOP/BRPOP |
redis_memory_used_bytes | Used memory |
redis_memory_max_bytes | maxmemory configuration value |
redis_keyspace_hits_total | Cache hits |
redis_keyspace_misses_total | Cache misses |
redis_commands_processed_total | Total commands executed |
redis_rejected_connections_total | Connections rejected (at maxclients) |
redis_replication_backlog_bytes | Replication backlog size |
redis_connected_slaves | Number of connected replicas |
Useful PromQL queries
# Cache hit ratio % (should be > 95%)
rate(redis_keyspace_hits_total[5m])
/ (rate(redis_keyspace_hits_total[5m]) + rate(redis_keyspace_misses_total[5m]))
* 100

# Memory usage % of maxmemory
redis_memory_used_bytes / redis_memory_max_bytes * 100

# Commands per second
rate(redis_commands_processed_total[5m])

# Connected clients
redis_connected_clients

# Evicted keys rate (memory pressure indicator)
rate(redis_evicted_keys_total[5m])
Troubleshooting
redis_up 0
- Check
--redis.addris correct - If Redis requires auth, ensure
REDIS_PASSWORDis set
Missing redis_memory_max_bytes
- If
maxmemoryis0(unlimited), this metric is0. Set amaxmemoryvalue in your Redis config to track usage meaningfully.