Node.js
Monitor Node.js heap memory, garbage collection, event loop lag, and active handles using the prom-client library.
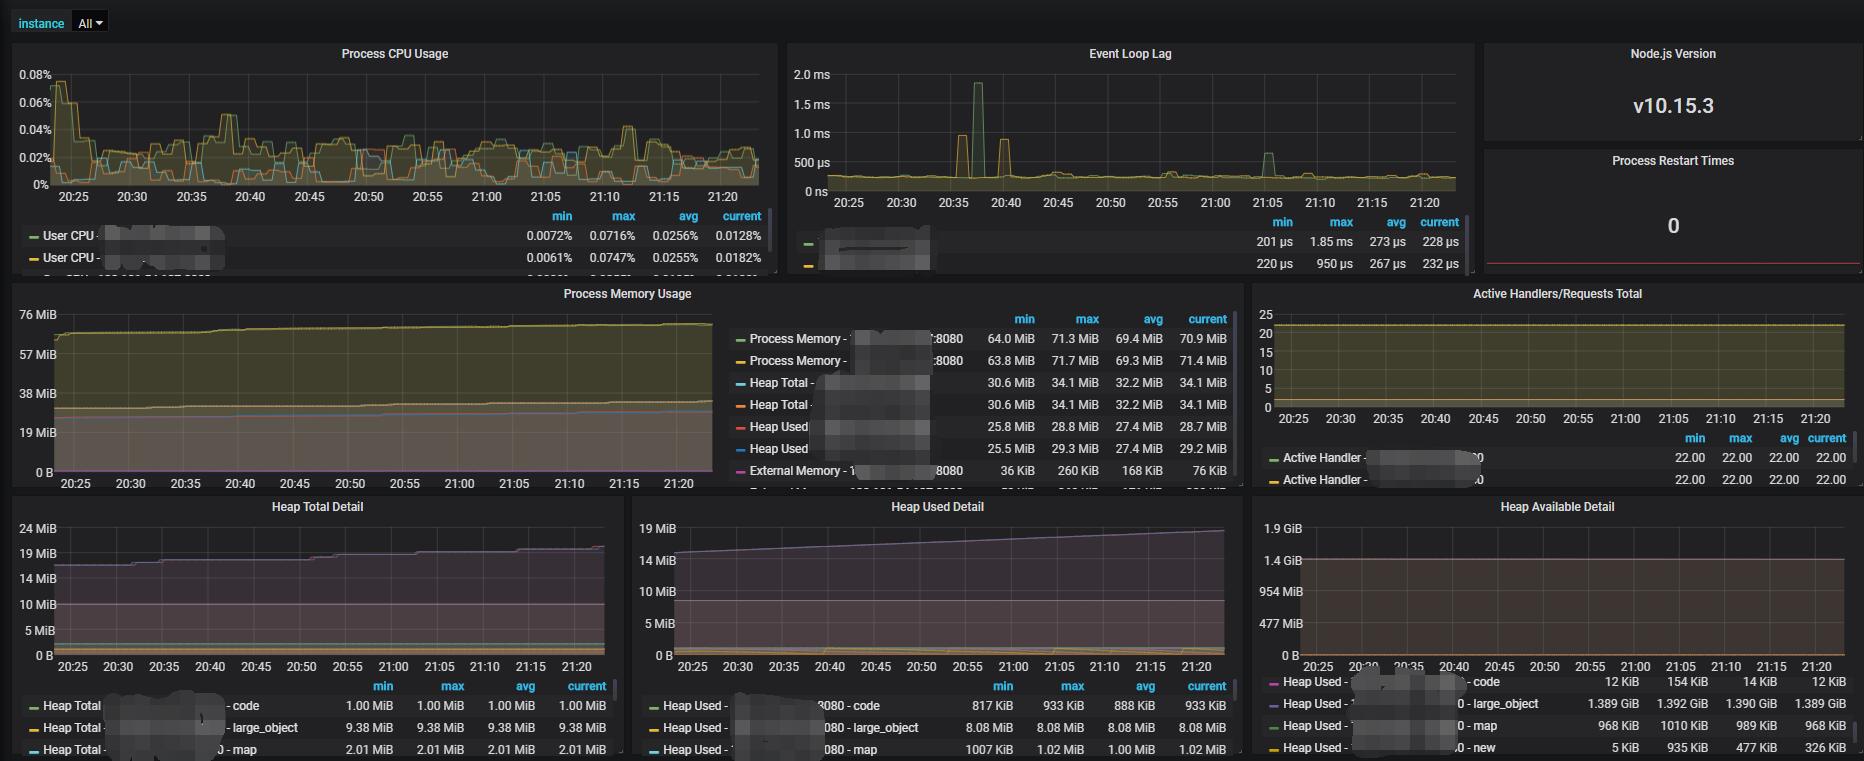
Key metrics
| Metric | Description |
|---|---|
nodejs_heap_size_used_bytes | Heap memory currently in use |
nodejs_heap_size_total_bytes | Total heap size allocated |
nodejs_gc_duration_seconds | GC duration histogram |
nodejs_active_handles_total | Active handles (sockets, timers) |
nodejs_eventloop_lag_seconds | Event loop lag |
process_cpu_user_seconds_total | CPU user time |
Prerequisites
- Node.js 14+
prom-clientnpm package
Configuration
Option A: prom-client
Install the library:
npm install prom-client
Expose metrics in your app:
const client = require('prom-client');
const express = require('express');
const app = express();

client.collectDefaultMetrics();

app.get('/metrics', async (req, res) => {
  res.set('Content-Type', client.register.contentType);
  res.end(await client.register.metrics());
});

app.listen(9091);
Prometheus scrape
scrape_configs:
  - job_name: nodejs
    static_configs:
      - targets: ['localhost:9091']

remote_write:
  - url: https://<region>.xscalerlabs.com/api/v1/push
    headers:
      X-Scope-OrgID: <tenant-id>
    basic_auth:
      password: <api-token>
Option B: Grafana Alloy
prometheus.scrape "nodejs" {
  targets    = [{"__address__" = "localhost:9091"}]
  forward_to = [prometheus.remote_write.xscaler.receiver]
}

prometheus.remote_write "xscaler" {
  endpoint {
    url = "https://<region>.xscalerlabs.com/api/v1/push"
    headers = { "X-Scope-OrgID" = "<tenant-id>" }
    basic_auth { password = "<api-token>" }
  }
}
Option C: OpenTelemetry Collector
receivers:
  prometheus:
    config:
      scrape_configs:
        - job_name: nodejs
          static_configs:
            - targets: ['localhost:9091']

exporters:
  prometheusremotewrite:
    endpoint: https://<region>.xscalerlabs.com/api/v1/push
    headers:
      Authorization: Bearer <api-token>
      X-Scope-OrgID: <tenant-id>

service:
  pipelines:
    metrics:
      receivers: [prometheus]
      exporters: [prometheusremotewrite]
Logs
Collect application stdout/stderr. Pipe your process output to a log file and tail it with Alloy. Add the following to your Alloy config, adjusting __path__ to match your application's log file location:
local.file_match "nodejs_logs" {
  path_targets = [{
    __address__ = "localhost",
    __path__    = "/var/log/nodejs/app.log",
    instance    = constants.hostname,
    job         = "integrations/nodejs",
  }]
}

loki.source.file "nodejs_logs" {
  targets    = local.file_match.nodejs_logs.targets
  forward_to = [loki.write.xscaler.receiver]
}

loki.write "xscaler" {
  endpoint {
    url = "https://euw1-01.l.xscalerlabs.com/api/v1/push"

    http_client_config {
      authorization {
        type        = "Bearer"
        credentials = env("XSCALER_TOKEN")
      }
    }

    headers = { "X-Scope-OrgID" = env("XSCALER_TENANT_ID") }
  }
}