NetFlow / IPFIX / sFlow
Collect and visualise network flow telemetry from any NetFlow 5/9, IPFIX, or sFlow-enabled device using ktranslate: bytes per flow, top talkers, protocol breakdown, and interface utilisation.
Pattern: Network device → ktranslate (port 9995) → Grafana Alloy (OTLP gRPC) → xScaler OTLP endpoint
Dashboards
Setting up the integration gives you two dashboards.
NetFlow Overview
Top source/destination IPs, top protocols, bytes by flow, and total throughput.
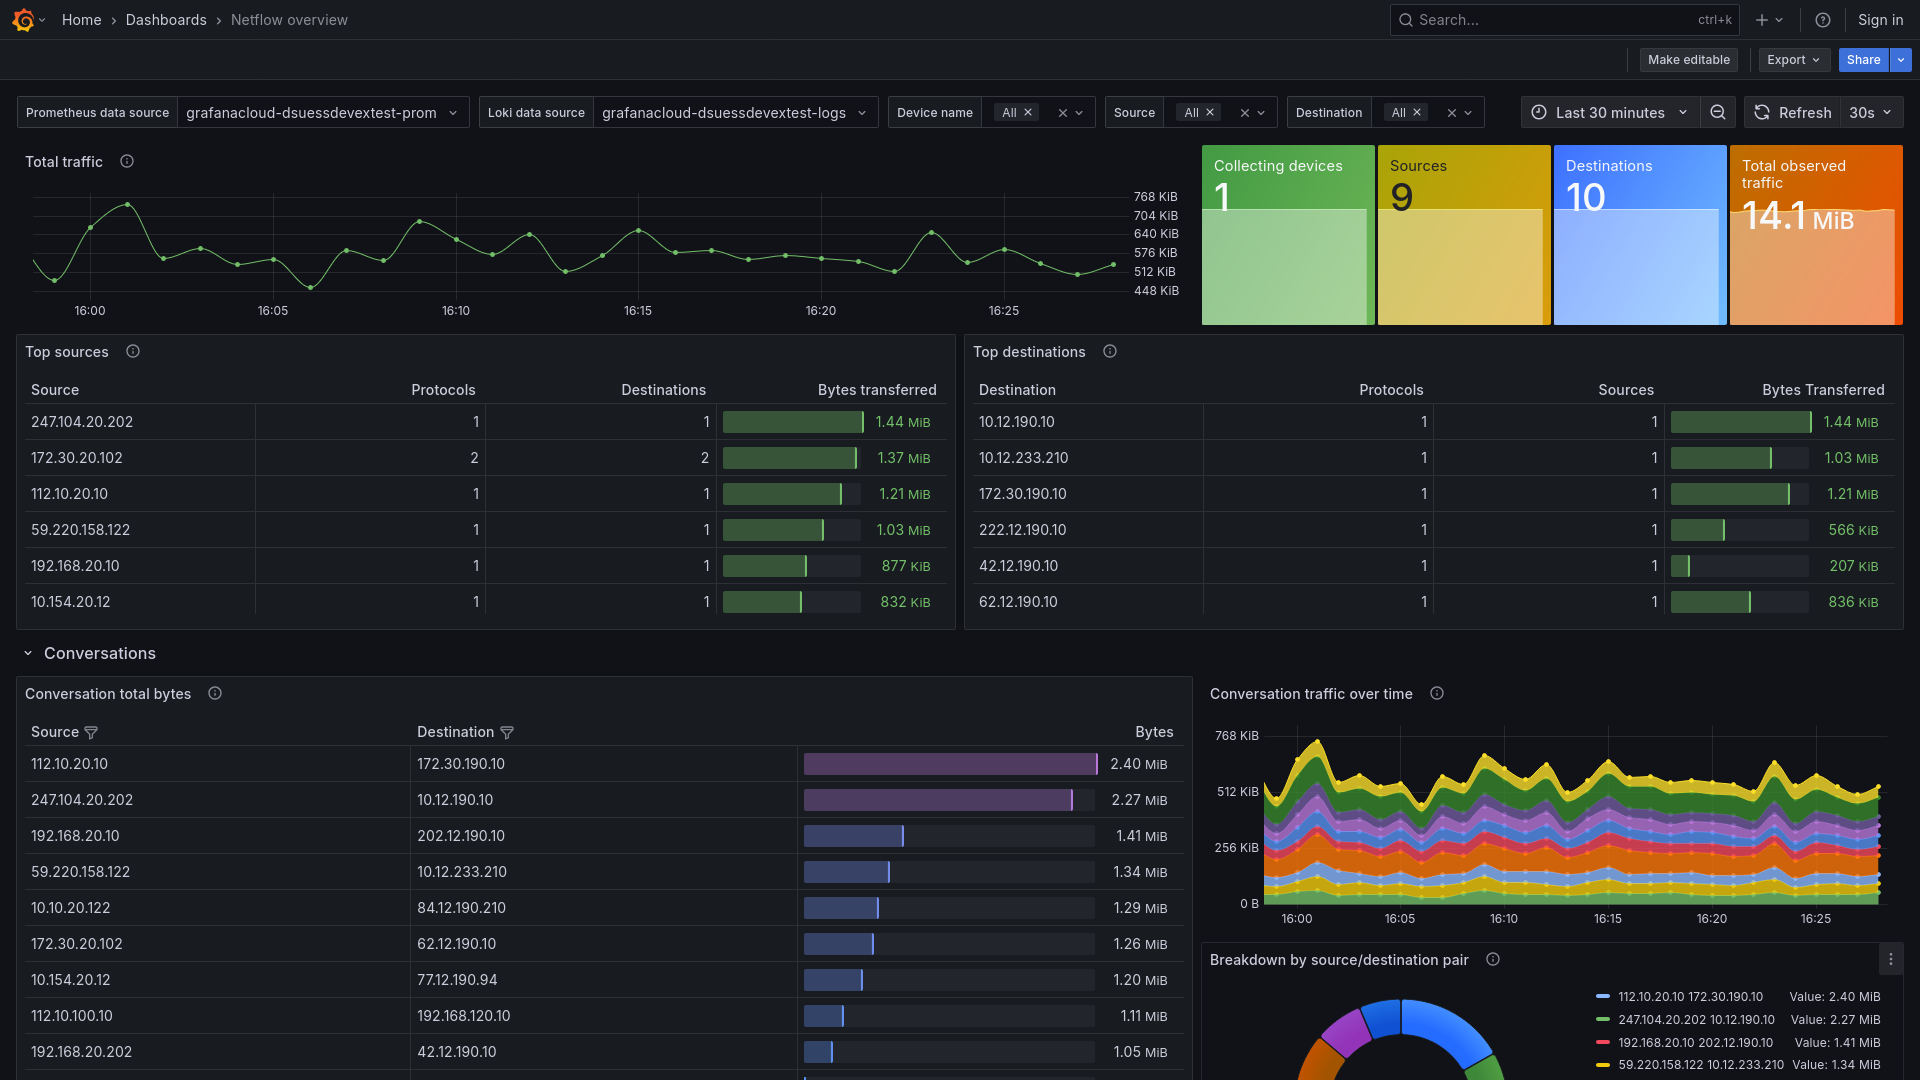
NetFlow Overview, Part 2
Interface-level breakdown, AS number analysis, DSCP markings, and flow sampling rates.
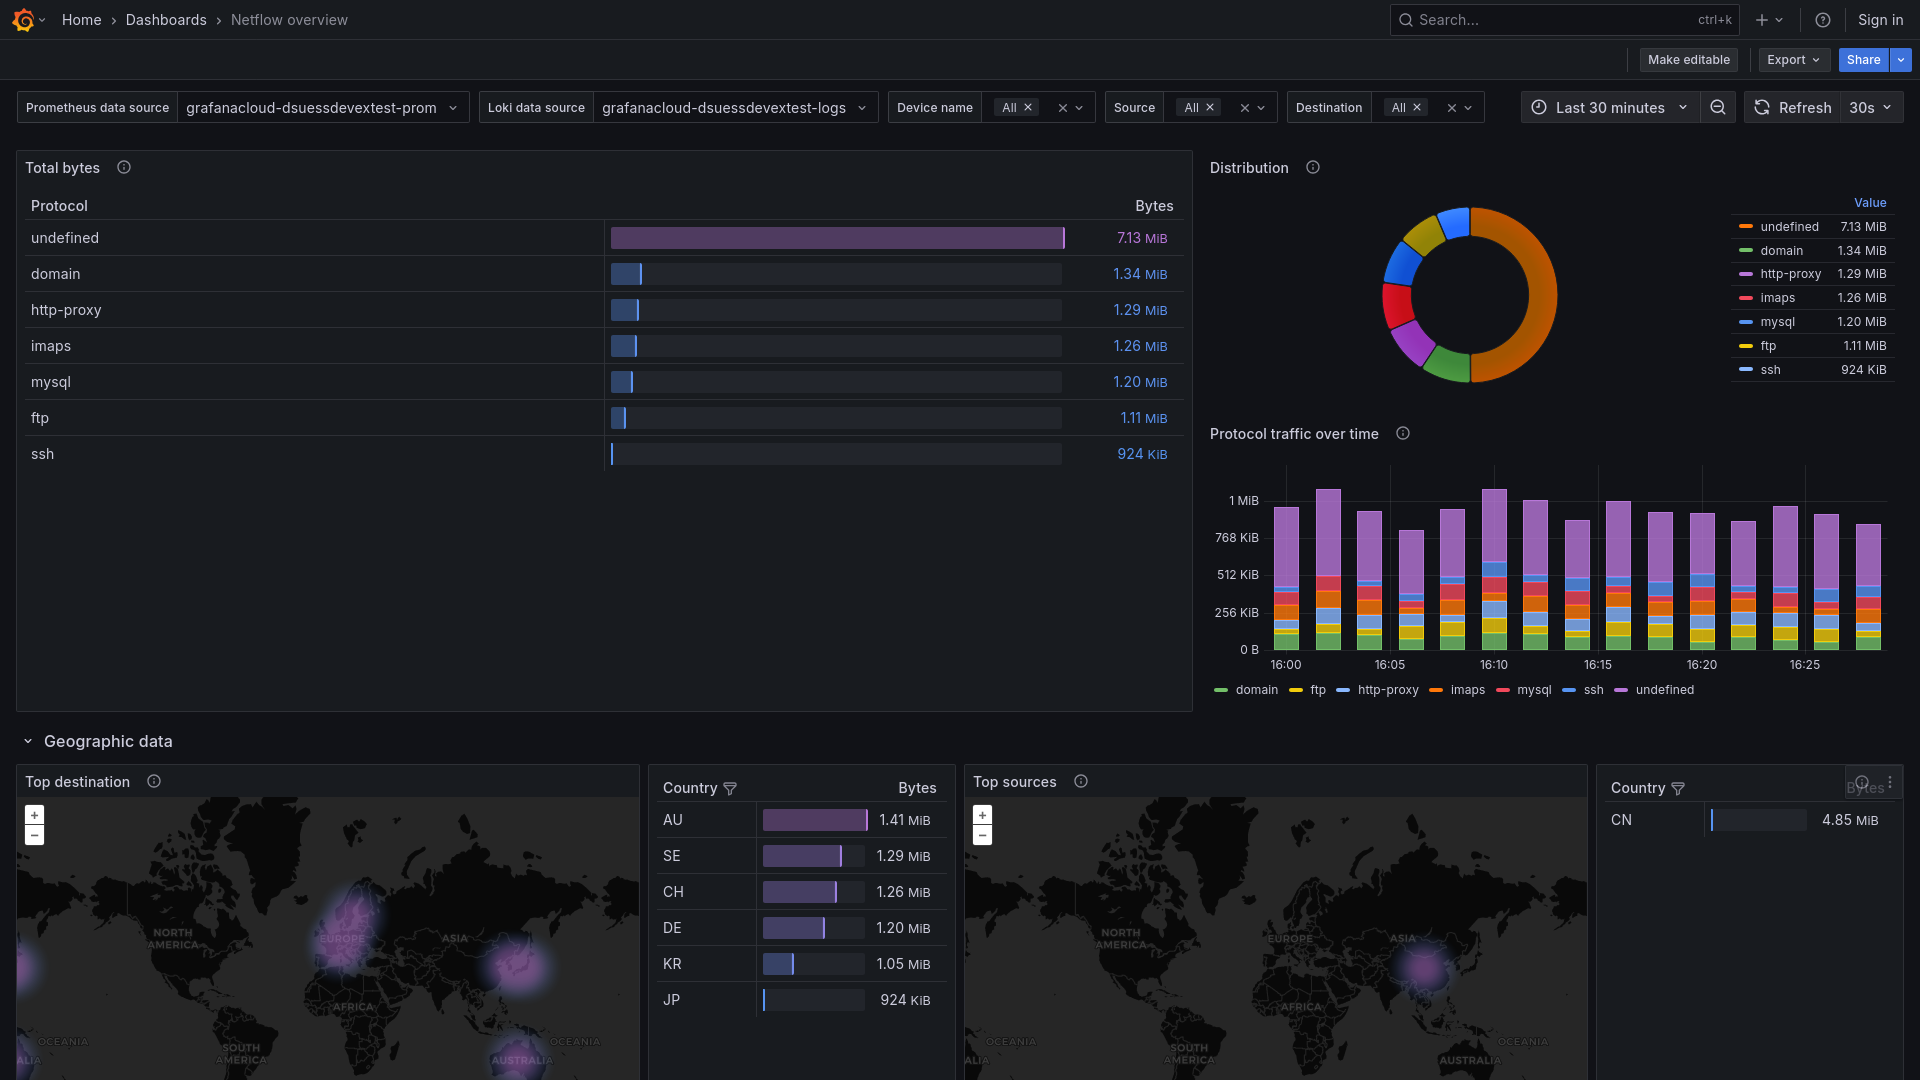
xScaler installs these dashboards when you configure the integration. Import them into any Grafana instance connected to xScaler.
Prerequisites
- A network device that supports NetFlow v5/v9, IPFIX, or sFlow (Cisco, Juniper, Palo Alto, Nokia, etc.)
- Docker or a Linux host to run ktranslate
- Grafana Alloy running and reachable from the ktranslate host
- xScaler tenant credentials (token + tenant ID)
Step 1: Configure Grafana Alloy
Add this to your Alloy config to receive OTLP metrics from ktranslate and forward them to xScaler:
otelcol.receiver.otlp "netflow" {
  grpc {
    endpoint = "0.0.0.0:4317"
  }
  output {
    metrics = [otelcol.processor.batch.default.input]
  }
}

otelcol.processor.batch "default" {
  output {
    metrics = [otelcol.exporter.otlphttp.xscaler.input]
  }
}

otelcol.exporter.otlphttp "xscaler" {
  client {
    endpoint = "https://euw1-01.m.xscalerlabs.com"
    headers  = {
      "Authorization" = "Bearer <token>",
      "X-Scope-OrgID" = "<tenant-id>",
    }
    tls { insecure = false }
  }
}
Step 2: Deploy ktranslate
Run ktranslate with Docker. It listens for flows on UDP port 9995 and forwards converted metrics to Alloy via OTLP gRPC:
docker run -d \
  --name ktranslate-netflow \
  --restart unless-stopped \
  -p 9995:9995/udp \
  kentik/ktranslate:latest \
    --snmp /etc/ktranslate/snmp-base.yaml \
    --log_level info \
    --metrics otel \
    --format netflow \
    --nf.source 0.0.0.0:9995 \
    --sink grpc \
    --sink_url http://<alloy-host>:4317 \
    --rollup_interval 60 \
    --nf.workers 4 \
    --geo \
    --nf.message.fields src_addr,dst_addr,src_port,dst_port,protocol,in_bytes,in_pkts,tcp_flags,src_as,dst_as,input_snmp,output_snmp
Replace <alloy-host> with the hostname or IP of your Alloy instance.
If ktranslate and Alloy run on the same host, use --sink_url http://localhost:4317.
Step 3: Configure your network devices
Point your routers and switches to send flows to the ktranslate host:
Cisco IOS / IOS-XE (NetFlow v9)
ip flow-export destination <ktranslate-ip> 9995
ip flow-export version 9
ip flow-export source Loopback0
interface GigabitEthernet0/0
  ip flow ingress
  ip flow egress
Juniper (IPFIX)
set forwarding-options sampling instance flow-collector input rate 100
set forwarding-options sampling instance flow-collector family inet output flow-server <ktranslate-ip> port 9995
set forwarding-options sampling instance flow-collector family inet output flow-server <ktranslate-ip> version-ipfix
sFlow (generic)
sflow agent-ip <device-ip>
sflow collector-ip <ktranslate-ip>
sflow collector-port 9995
sflow sampling-rate 1024
sflow polling-interval 30
Option B: Prometheus remote_write (alternative)
If you prefer Prometheus instead of OTel, ktranslate can expose a /metrics endpoint:
docker run -d \
  -p 9995:9995/udp \
  -p 8082:8082 \
  kentik/ktranslate:latest \
    --format netflow \
    --nf.source 0.0.0.0:9995 \
    --sink prometheus \
    --rollup_interval 60
scrape_configs:
  - job_name: netflow
    static_configs:
      - targets: ['localhost:8082']
    metrics_path: /metrics

remote_write:
  - url: https://euw1-01.m.xscalerlabs.com/api/v1/push
    authorization:
      credentials: <token>
    headers:
      X-Scope-OrgID: <tenant-id>
Logs
Collect ktranslate container log for flow processing errors and status. Add the following to your Alloy config:
discovery.docker "netflow_containers" {
  host = "unix:///var/run/docker.sock"
  filter {
    name   = "name"
    values = ["ktranslate"]
  }
}

discovery.relabel "netflow_logs" {
  targets = discovery.docker.netflow_containers.targets
  rule {
    source_labels = ["__meta_docker_container_name"]
    regex         = "/(.*)"
    target_label  = "container"
  }
  rule {
    replacement  = "integrations/netflow"
    target_label = "job"
  }
}

loki.source.docker "netflow_logs" {
  host       = "unix:///var/run/docker.sock"
  targets    = discovery.relabel.netflow_logs.output
  forward_to = [loki.write.xscaler.receiver]
  labels     = { instance = constants.hostname }
}

loki.write "xscaler" {
  endpoint {
    url = "https://euw1-01.l.xscalerlabs.com/api/v1/push"

    http_client_config {
      authorization {
        type        = "Bearer"
        credentials = env("XSCALER_TOKEN")
      }
    }

    headers = { "X-Scope-OrgID" = env("XSCALER_TENANT_ID") }
  }
}
Key metrics
| Metric | Description |
|---|---|
network_io_by_flow_bytes | Bytes transferred, labelled by src/dst IP, port, protocol |
network_io_by_flow_packets | Packet count per flow |
network_io_interface_bytes | Bytes in/out per SNMP interface index |
network_flow_sample_rate | Flow sampling rate from the exporter |
network_flow_src_as | Source Autonomous System number |
network_flow_dst_as | Destination Autonomous System number |
up | ktranslate exporter health (1 = up) |
Useful PromQL queries
# Top 10 source IPs by bytes (last 5 min)
topk(10, sum by (src_addr) (rate(network_io_by_flow_bytes[5m])))

# Total inbound throughput (bytes/sec)
sum(rate(network_io_by_flow_bytes{direction="in"}[5m]))

# Top protocols by traffic volume
sum by (protocol) (rate(network_io_by_flow_bytes[5m]))

# Traffic between two specific subnets
sum(rate(network_io_by_flow_bytes{src_addr=~"10.0.1.*", dst_addr=~"10.0.2.*"}[5m]))
Troubleshooting
No flows arriving
- Confirm ktranslate container is running:
docker logs ktranslate-netflow - Verify UDP port 9995 is open:
tcpdump -i any udp port 9995 - Check the device flow export destination IP and port
Metrics not appearing in xScaler
- Confirm Alloy is receiving from ktranslate: check Alloy logs for OTLP receiver activity
- Verify the
Authorizationheader has a valid Bearer token - Ensure
X-Scope-OrgIDmatches your tenant ID exactly