MySQL
Collect query throughput, connection pool, InnoDB buffer pool, replication status, and slow query metrics from MySQL using mysqld_exporter.
Pattern: mysqld_exporter → Prometheus scrape → xScaler remote_write
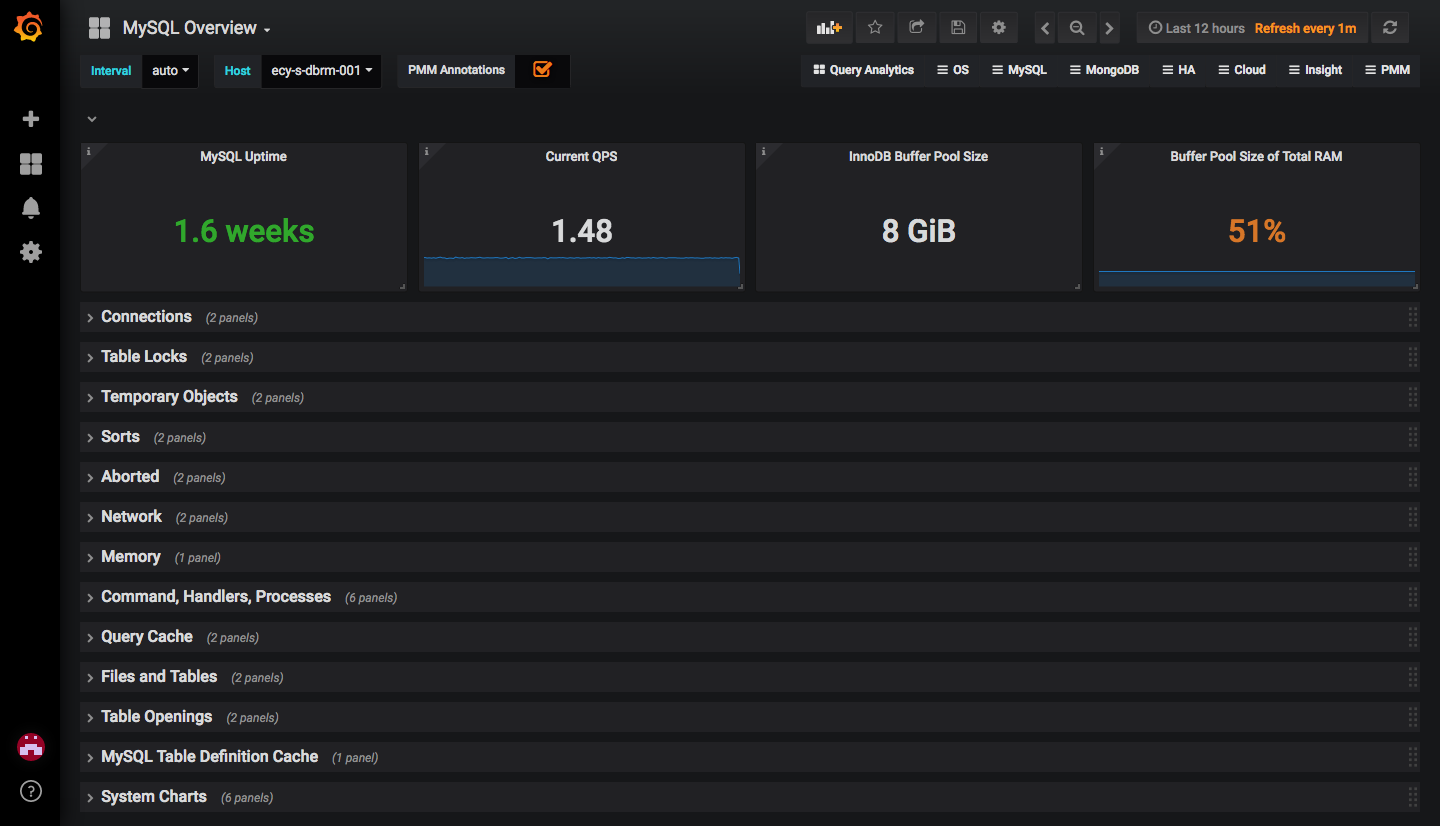
Dashboard
Prerequisites
- MySQL 5.7 or later (or MariaDB 10.3+)
- A dedicated monitoring user
- Prometheus or Grafana Alloy
- xScaler tenant credentials
Step 1: Create a monitoring user
CREATE USER 'xscaler_monitor'@'localhost' IDENTIFIED BY 'strongpassword' WITH MAX_USER_CONNECTIONS 3;
GRANT PROCESS, REPLICATION CLIENT, SELECT ON *.* TO 'xscaler_monitor'@'localhost';
FLUSH PRIVILEGES;
Step 2: Run mysqld_exporter
docker run --rm -d \
  --name mysql-exporter \
  --network host \
  -e DATA_SOURCE_NAME="xscaler_monitor:strongpassword@(localhost:3306)/" \
  prom/mysqld-exporter \
  --collect.global_status \
  --collect.global_variables \
  --collect.info_schema.innodb_metrics \
  --collect.info_schema.processlist \
  --collect.slave_status
Verify:
curl -s http://localhost:9104/metrics | grep mysql_up
# mysql_up 1
Step 3: Scrape and forward to xScaler
Prometheus
scrape_configs:
  - job_name: mysql
    static_configs:
      - targets: ['localhost:9104']
        labels:
          instance: primary

remote_write:
  - url: https://euw1-01.m.xscalerlabs.com/api/v1/push
    authorization:
      credentials: <token>
    headers:
      X-Scope-OrgID: <tenant-id>
Grafana Alloy
prometheus.scrape "mysql" {
  targets    = [{"__address__" = "localhost:9104"}]
  forward_to = [prometheus.remote_write.xscaler.receiver]
}

prometheus.remote_write "xscaler" {
  endpoint {
    url = "https://euw1-01.m.xscalerlabs.com/api/v1/push"
    authorization {
      type        = "Bearer"
      credentials = "<token>"
    }
    headers = { "X-Scope-OrgID" = "<tenant-id>" }
  }
}
OpenTelemetry Collector
receivers:
  mysql:
    endpoint: localhost:3306
    username: xscaler_monitor
    password: strongpassword
    collection_interval: 15s

processors:
  memory_limiter:
    check_interval: 1s
    limit_mib: 256
  batch:
    timeout: 10s

exporters:
  otlphttp/xscaler:
    endpoint: https://euw1-01.m.xscalerlabs.com
    headers:
      Authorization: "Bearer <token>"
      X-Scope-OrgID: "<tenant-id>"

service:
  pipelines:
    metrics:
      receivers:  [mysql]
      processors: [memory_limiter, batch]
      exporters:  [otlphttp/xscaler]
Logs
Collect error log, slow query log, and general query log. Add the following to your Alloy config:
local.file_match "mysql_logs" {
  path_targets = [{
    __address__ = "localhost",
    __path__    = "/var/log/mysql/*.log",
    instance    = constants.hostname,
    job         = "integrations/mysql",
  }]
}

loki.source.file "mysql_logs" {
  targets    = local.file_match.mysql_logs.targets
  forward_to = [loki.write.xscaler.receiver]
}

loki.write "xscaler" {
  endpoint {
    url = "https://euw1-01.l.xscalerlabs.com/api/v1/push"

    http_client_config {
      authorization {
        type        = "Bearer"
        credentials = env("XSCALER_TOKEN")
      }
    }

    headers = { "X-Scope-OrgID" = env("XSCALER_TENANT_ID") }
  }
}
Key metrics
| Metric | Description |
|---|---|
mysql_up | Exporter reachability (1 = up) |
mysql_global_status_threads_connected | Current open connections |
mysql_global_variables_max_connections | Max allowed connections |
mysql_global_status_queries | Total queries executed |
mysql_global_status_slow_queries | Queries exceeding long_query_time |
mysql_global_status_innodb_buffer_pool_reads | InnoDB disk reads (cache misses) |
mysql_global_status_innodb_buffer_pool_read_requests | InnoDB buffer pool requests |
mysql_global_status_bytes_received | Bytes received from clients |
mysql_global_status_bytes_sent | Bytes sent to clients |
mysql_slave_status_seconds_behind_master | Replication lag (seconds) |
Useful PromQL queries
# Connection usage %
mysql_global_status_threads_connected
/ mysql_global_variables_max_connections * 100

# Query rate/sec
rate(mysql_global_status_queries[5m])

# InnoDB buffer pool hit ratio (should be > 99%)
(1 - rate(mysql_global_status_innodb_buffer_pool_reads[5m])
   / rate(mysql_global_status_innodb_buffer_pool_read_requests[5m])) * 100

# Slow queries rate
rate(mysql_global_status_slow_queries[5m])

# Replication lag
mysql_slave_status_seconds_behind_master