Microsoft SQL Server
Monitor SQL Server connections, I/O stall, buffer pool health, and transaction rates.
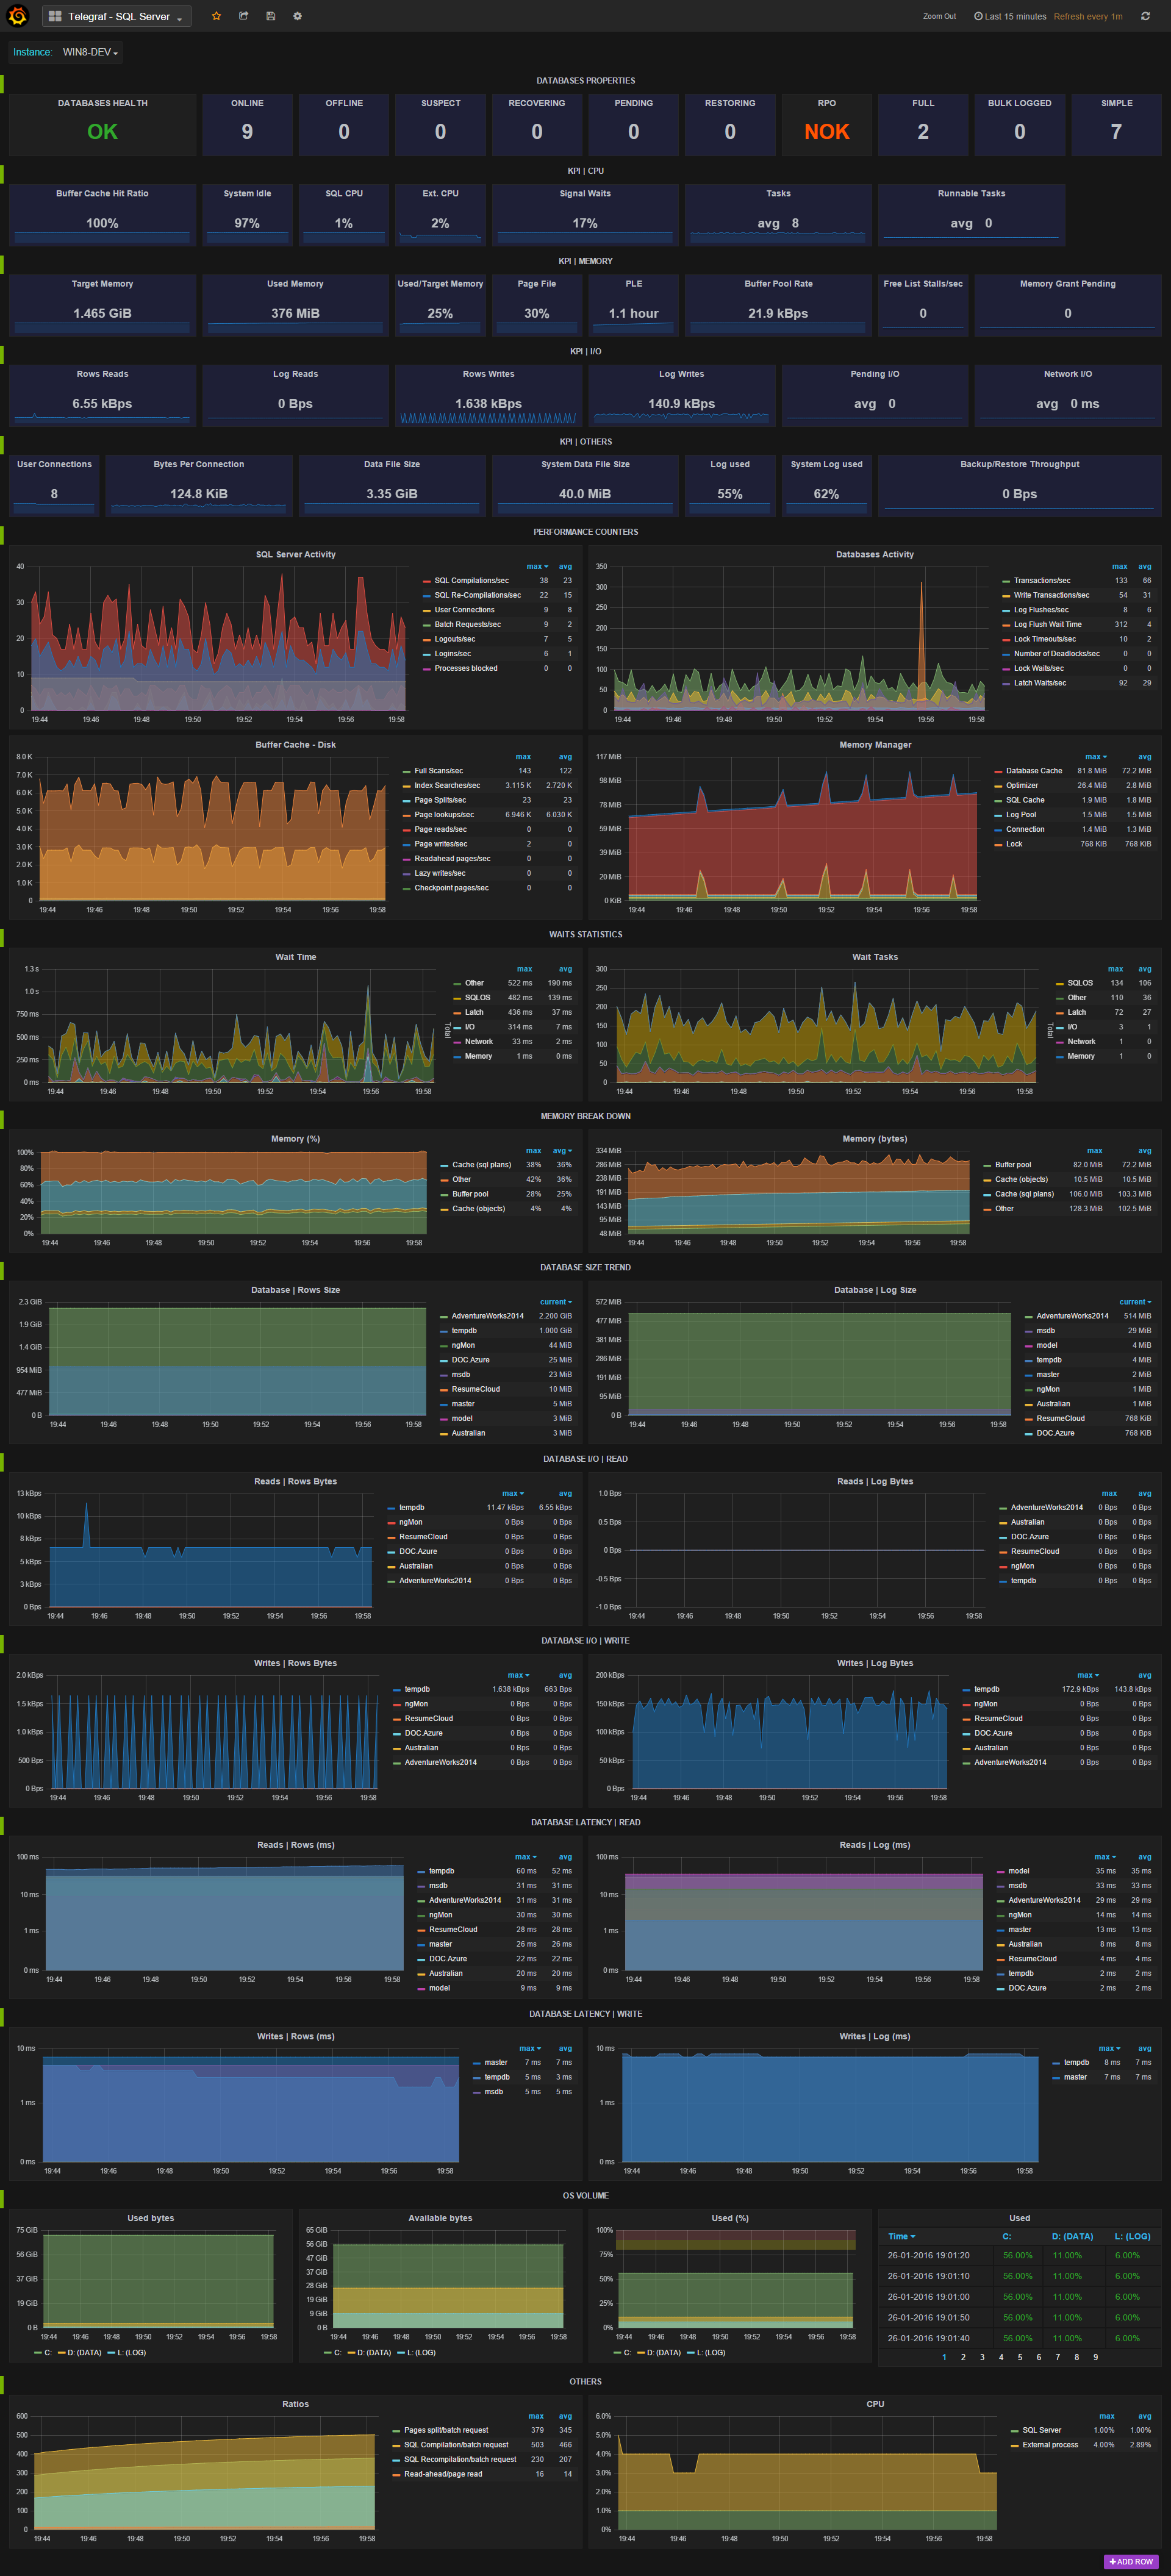
Key metrics
| Metric | Description |
|---|---|
mssql_connections | Active connections per database |
mssql_io_stall_seconds_total | Cumulative I/O stall time |
mssql_page_life_expectancy_seconds | Buffer pool page life expectancy |
mssql_batch_requests_total | Batch requests per second |
mssql_transactions_total | Transactions per second |
mssql_deadlocks_total | Deadlock count |
Prerequisites
- SQL Server 2016+ (or Azure SQL)
- A monitoring login with
VIEW SERVER STATEpermission
Configuration
Create monitoring user
CREATE LOGIN sql_exporter WITH PASSWORD = 'StrongPassword!';
GRANT VIEW SERVER STATE TO sql_exporter;
GRANT VIEW ANY DEFINITION TO sql_exporter;
Option A: sql_exporter
Download sql_exporter:
./sql_exporter \
  --config.file=sql_exporter.yml \
  --web.listen-address=:4000
# sql_exporter.yml
target:
  data_source_name: 'sqlserver://sql_exporter:StrongPassword!@localhost:1433'
  collectors: [mssql_standard]
Prometheus scrape
scrape_configs:
  - job_name: mssql
    static_configs:
      - targets: ['localhost:4000']

remote_write:
  - url: https://<region>.xscalerlabs.com/api/v1/push
    headers:
      X-Scope-OrgID: <tenant-id>
    basic_auth:
      password: <api-token>
Option B: Grafana Alloy
prometheus.scrape "mssql" {
  targets    = [{"__address__" = "localhost:4000"}]
  forward_to = [prometheus.remote_write.xscaler.receiver]
}

prometheus.remote_write "xscaler" {
  endpoint {
    url = "https://<region>.xscalerlabs.com/api/v1/push"
    headers = { "X-Scope-OrgID" = "<tenant-id>" }
    basic_auth { password = "<api-token>" }
  }
}
Option C: OpenTelemetry Collector
receivers:
  sqlserver:
    collection_interval: 60s
    username: sql_exporter
    password: ${MSSQL_PASSWORD}
    server: localhost
    port: 1433

exporters:
  prometheusremotewrite:
    endpoint: https://<region>.xscalerlabs.com/api/v1/push
    headers:
      Authorization: Bearer <api-token>
      X-Scope-OrgID: <tenant-id>

service:
  pipelines:
    metrics:
      receivers: [sqlserver]
      exporters: [prometheusremotewrite]
Logs
Collect SQL Server error log (Linux). On Windows use the Windows Event Log source.. Add the following to your Alloy config:
local.file_match "mssql_logs" {
  path_targets = [{
    __address__ = "localhost",
    __path__    = "/var/opt/mssql/log/errorlog",
    instance    = constants.hostname,
    job         = "integrations/mssql",
  }]
}

loki.source.file "mssql_logs" {
  targets    = local.file_match.mssql_logs.targets
  forward_to = [loki.write.xscaler.receiver]
}

loki.write "xscaler" {
  endpoint {
    url = "https://euw1-01.l.xscalerlabs.com/api/v1/push"

    http_client_config {
      authorization {
        type        = "Bearer"
        credentials = env("XSCALER_TOKEN")
      }
    }

    headers = { "X-Scope-OrgID" = env("XSCALER_TENANT_ID") }
  }
}