MongoDB
Collect operation throughput, connection pool, replication lag, WiredTiger cache, and lock metrics from MongoDB using mongodb_exporter.
Pattern: mongodb_exporter → Prometheus scrape → xScaler remote_write
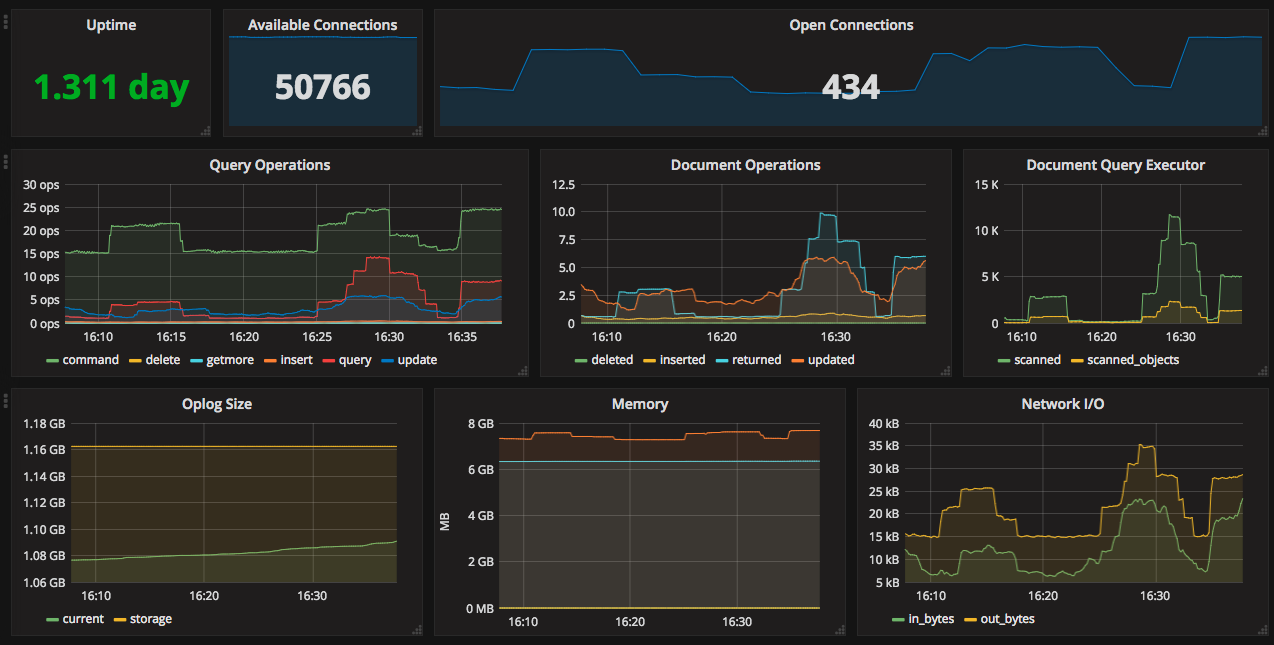
Dashboard
Prerequisites
- MongoDB 4.4 or later (replica set or standalone)
- A dedicated monitoring user
- Prometheus or Grafana Alloy
- xScaler tenant credentials
Step 1: Create a monitoring user
Connect to your MongoDB instance and run:
use admin
db.createUser({
  user: "xscaler_monitor",
  pwd: "strongpassword",
  roles: [
    { role: "clusterMonitor", db: "admin" },
    { role: "read", db: "local" }
  ]
})
Step 2: Run mongodb_exporter
docker run --rm -d \
  --name mongodb-exporter \
  -p 9216:9216 \
  percona/mongodb_exporter:0.40 \
  --mongodb.uri="mongodb://xscaler_monitor:strongpassword@localhost:27017" \
  --collect-all
Verify:
curl -s http://localhost:9216/metrics | grep mongodb_up
# mongodb_up 1
Step 3: Scrape and forward to xScaler
Prometheus
scrape_configs:
  - job_name: mongodb
    static_configs:
      - targets: ['localhost:9216']
        labels:
          instance: mongo-primary

remote_write:
  - url: https://euw1-01.m.xscalerlabs.com/api/v1/push
    authorization:
      credentials: <token>
    headers:
      X-Scope-OrgID: <tenant-id>
Grafana Alloy
prometheus.scrape "mongodb" {
  targets    = [{"__address__" = "localhost:9216"}]
  forward_to = [prometheus.remote_write.xscaler.receiver]
}

prometheus.remote_write "xscaler" {
  endpoint {
    url = "https://euw1-01.m.xscalerlabs.com/api/v1/push"
    authorization {
      type        = "Bearer"
      credentials = "<token>"
    }
    headers = { "X-Scope-OrgID" = "<tenant-id>" }
  }
}
OpenTelemetry Collector
receivers:
  mongodb:
    hosts:
      - endpoint: localhost:27017
    username: xscaler_monitor
    password: strongpassword
    collection_interval: 15s
    tls:
      insecure: true

processors:
  memory_limiter:
    check_interval: 1s
    limit_mib: 256
  batch:
    timeout: 10s

exporters:
  otlphttp/xscaler:
    endpoint: https://euw1-01.m.xscalerlabs.com
    headers:
      Authorization: "Bearer <token>"
      X-Scope-OrgID: "<tenant-id>"

service:
  pipelines:
    metrics:
      receivers:  [mongodb]
      processors: [memory_limiter, batch]
      exporters:  [otlphttp/xscaler]
Logs
Collect mongod log including queries, connections, and replica set events. Add the following to your Alloy config:
local.file_match "mongodb_logs" {
  path_targets = [{
    __address__ = "localhost",
    __path__    = "/var/log/mongodb/mongod.log",
    instance    = constants.hostname,
    job         = "integrations/mongodb",
  }]
}

loki.source.file "mongodb_logs" {
  targets    = local.file_match.mongodb_logs.targets
  forward_to = [loki.write.xscaler.receiver]
}

loki.write "xscaler" {
  endpoint {
    url = "https://euw1-01.l.xscalerlabs.com/api/v1/push"

    http_client_config {
      authorization {
        type        = "Bearer"
        credentials = env("XSCALER_TOKEN")
      }
    }

    headers = { "X-Scope-OrgID" = env("XSCALER_TENANT_ID") }
  }
}
Key metrics
| Metric | Description |
|---|---|
mongodb_up | Exporter reachability (1 = up) |
mongodb_connections_current | Current open connections |
mongodb_connections_available | Remaining available connections |
mongodb_op_counters_total | Operations by type (insert, query, update, delete) |
mongodb_wiredtiger_cache_bytes_currently_in_cache | WiredTiger cache used |
mongodb_wiredtiger_cache_max_bytes_configured | WiredTiger cache max size |
mongodb_wiredtiger_cache_pages_evicted_from_cache_total | Cache page evictions |
mongodb_repl_lag | Replication lag (seconds) |
mongodb_mongod_global_lock_wait_time | Global lock wait time (µs) |
mongodb_mongod_locks_time_locked_global_microseconds_total | Time spent holding global lock |
Useful PromQL queries
# Operation rate by type (inserts, queries, updates, deletes)
rate(mongodb_op_counters_total[5m])

# Connection usage %
mongodb_connections_current
/ (mongodb_connections_current + mongodb_connections_available) * 100

# WiredTiger cache usage %
mongodb_wiredtiger_cache_bytes_currently_in_cache
/ mongodb_wiredtiger_cache_max_bytes_configured * 100

# Replication lag (seconds)
mongodb_repl_lag

# Cache eviction rate (memory pressure indicator)
rate(mongodb_wiredtiger_cache_pages_evicted_from_cache_total[5m])
Troubleshooting
mongodb_up 0
- Verify
--mongodb.uriis reachable from the exporter container - Ensure the monitoring user has
clusterMonitorrole:db.getUser("xscaler_monitor")in mongosh
No replication metrics
mongodb_repl_lagis only present on replica set members, not standalone instances- Confirm
rs.status()returns a valid replica set state
Missing WiredTiger metrics
- WiredTiger is the default storage engine since MongoDB 3.2; if you're using MMAPv1, these metrics won't appear