Linux
Collect system-level metrics from Linux hosts using the Prometheus node_exporter: CPU, memory, disk, network, filesystem, and more.
Pattern: node_exporter → Prometheus scrape → xScaler remote_write
Dashboards
Linux Node Overview
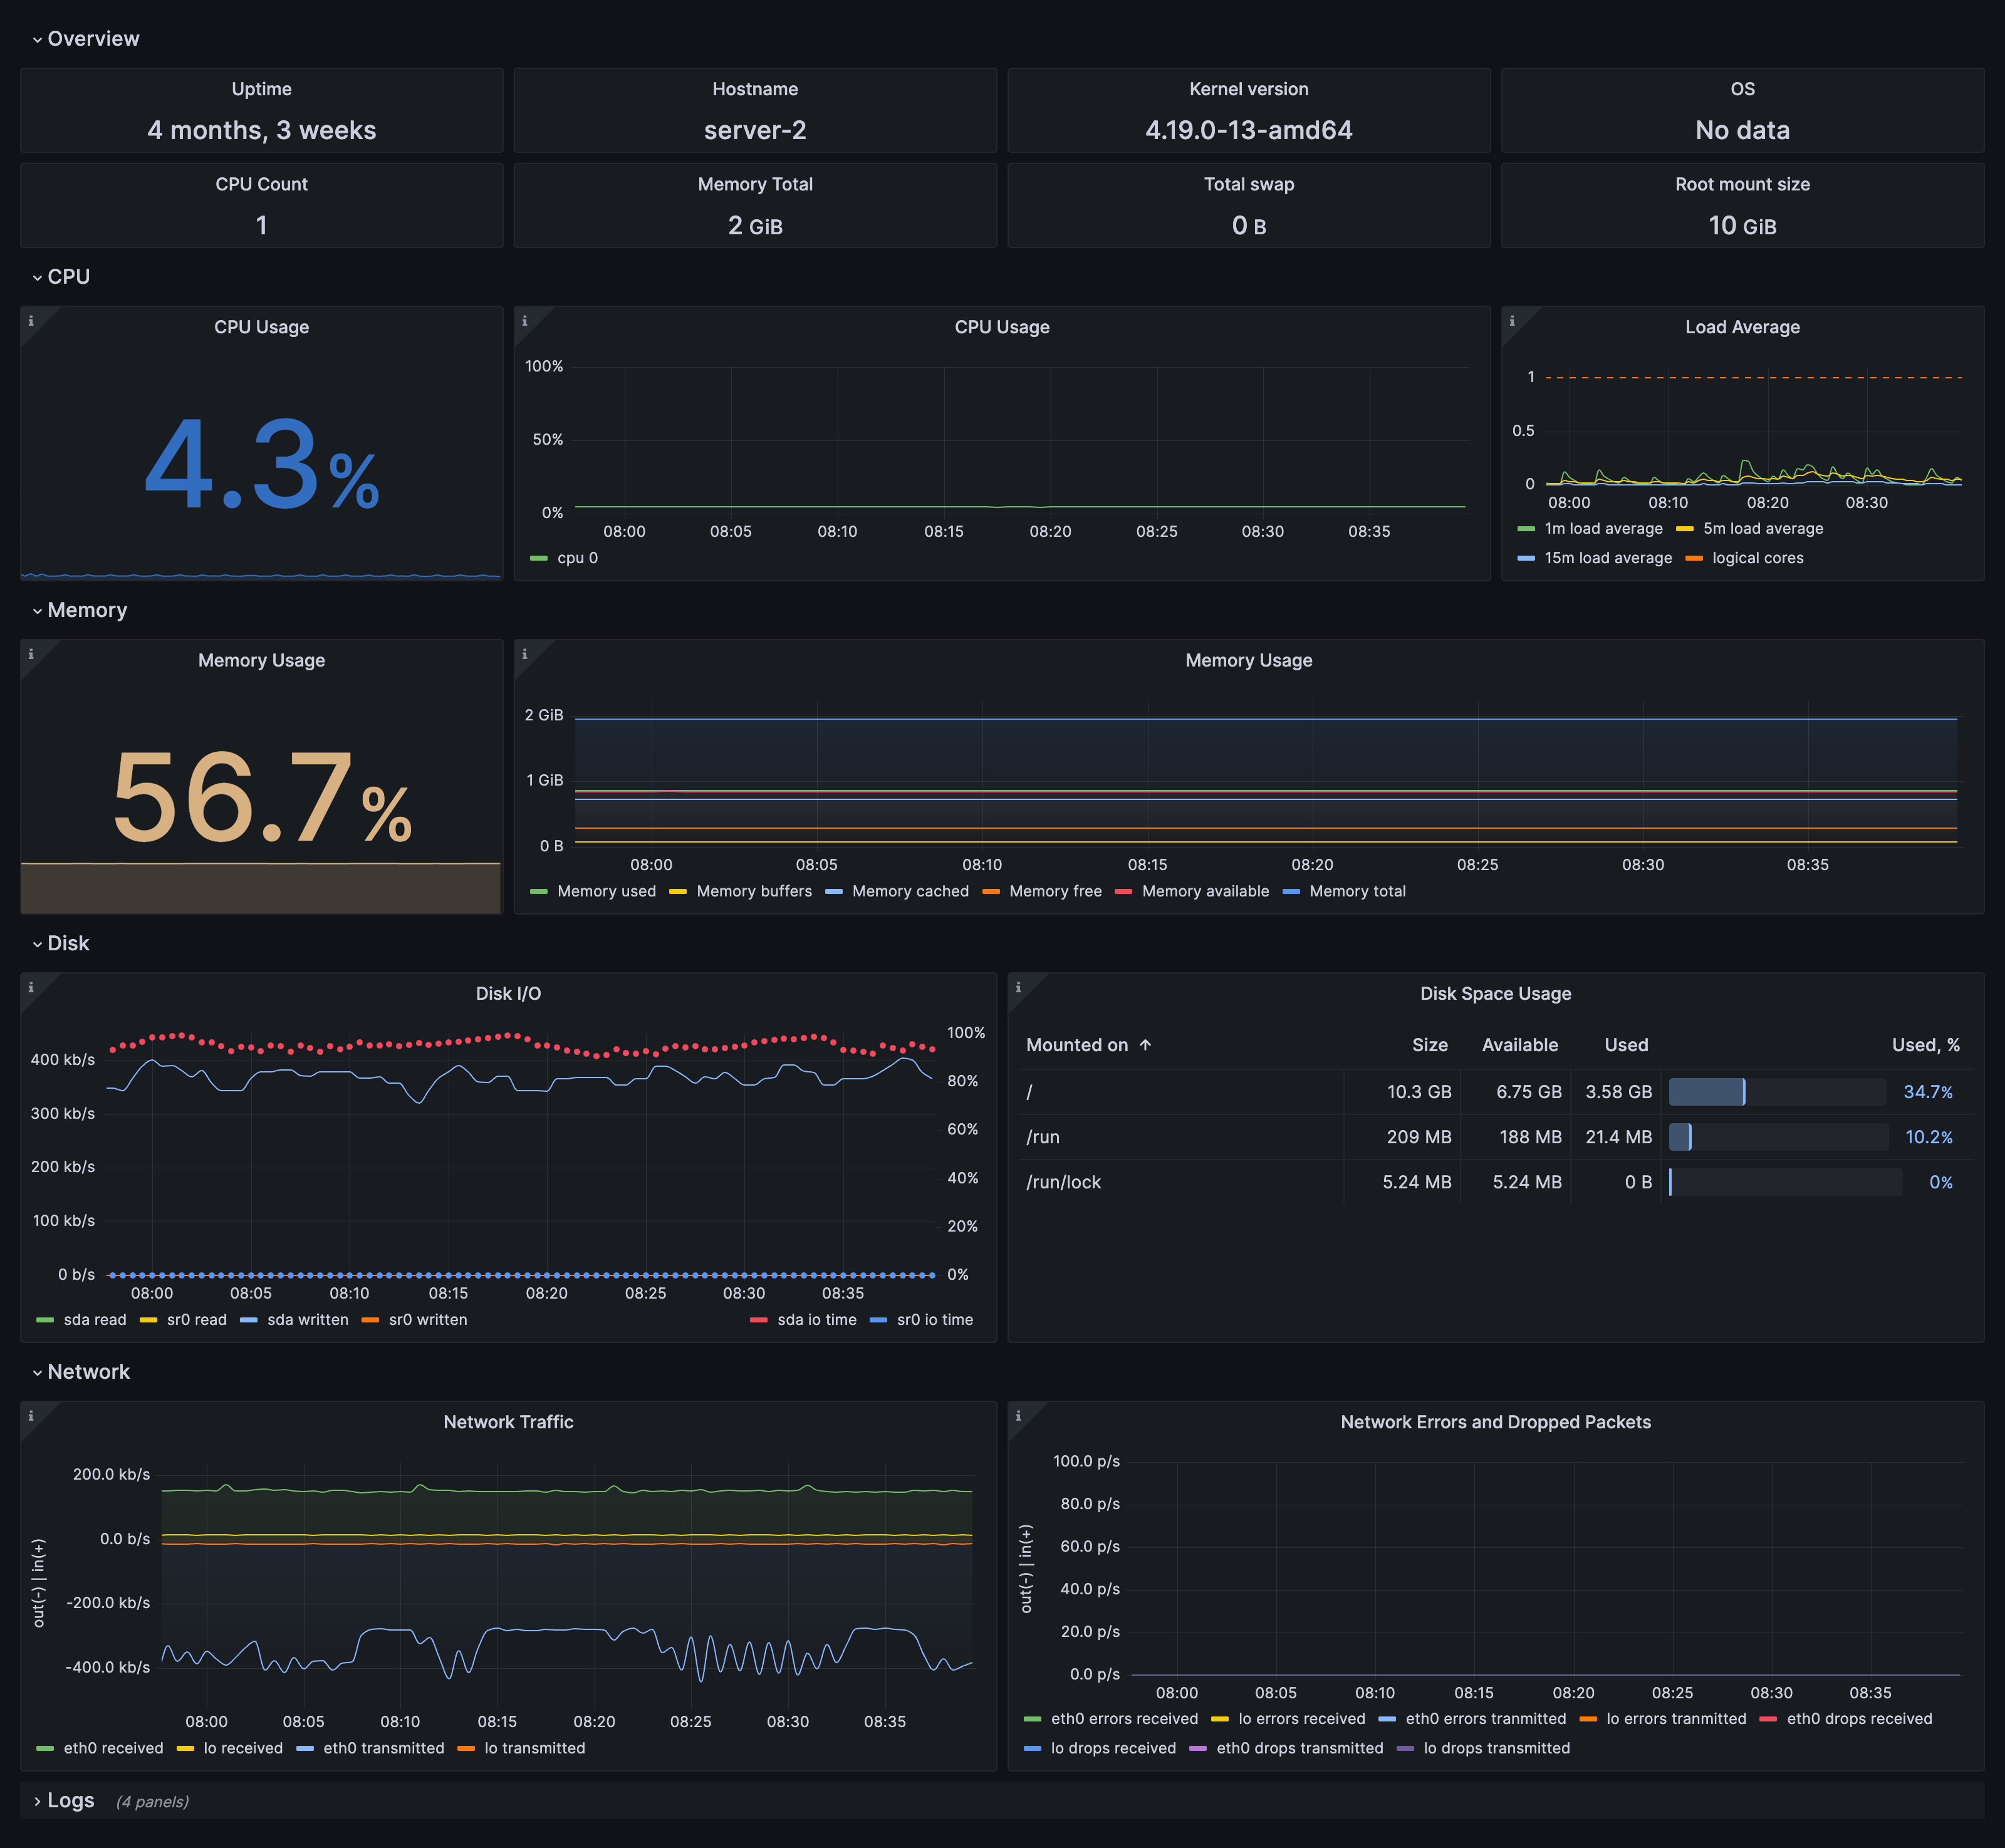
Linux Fleet Overview
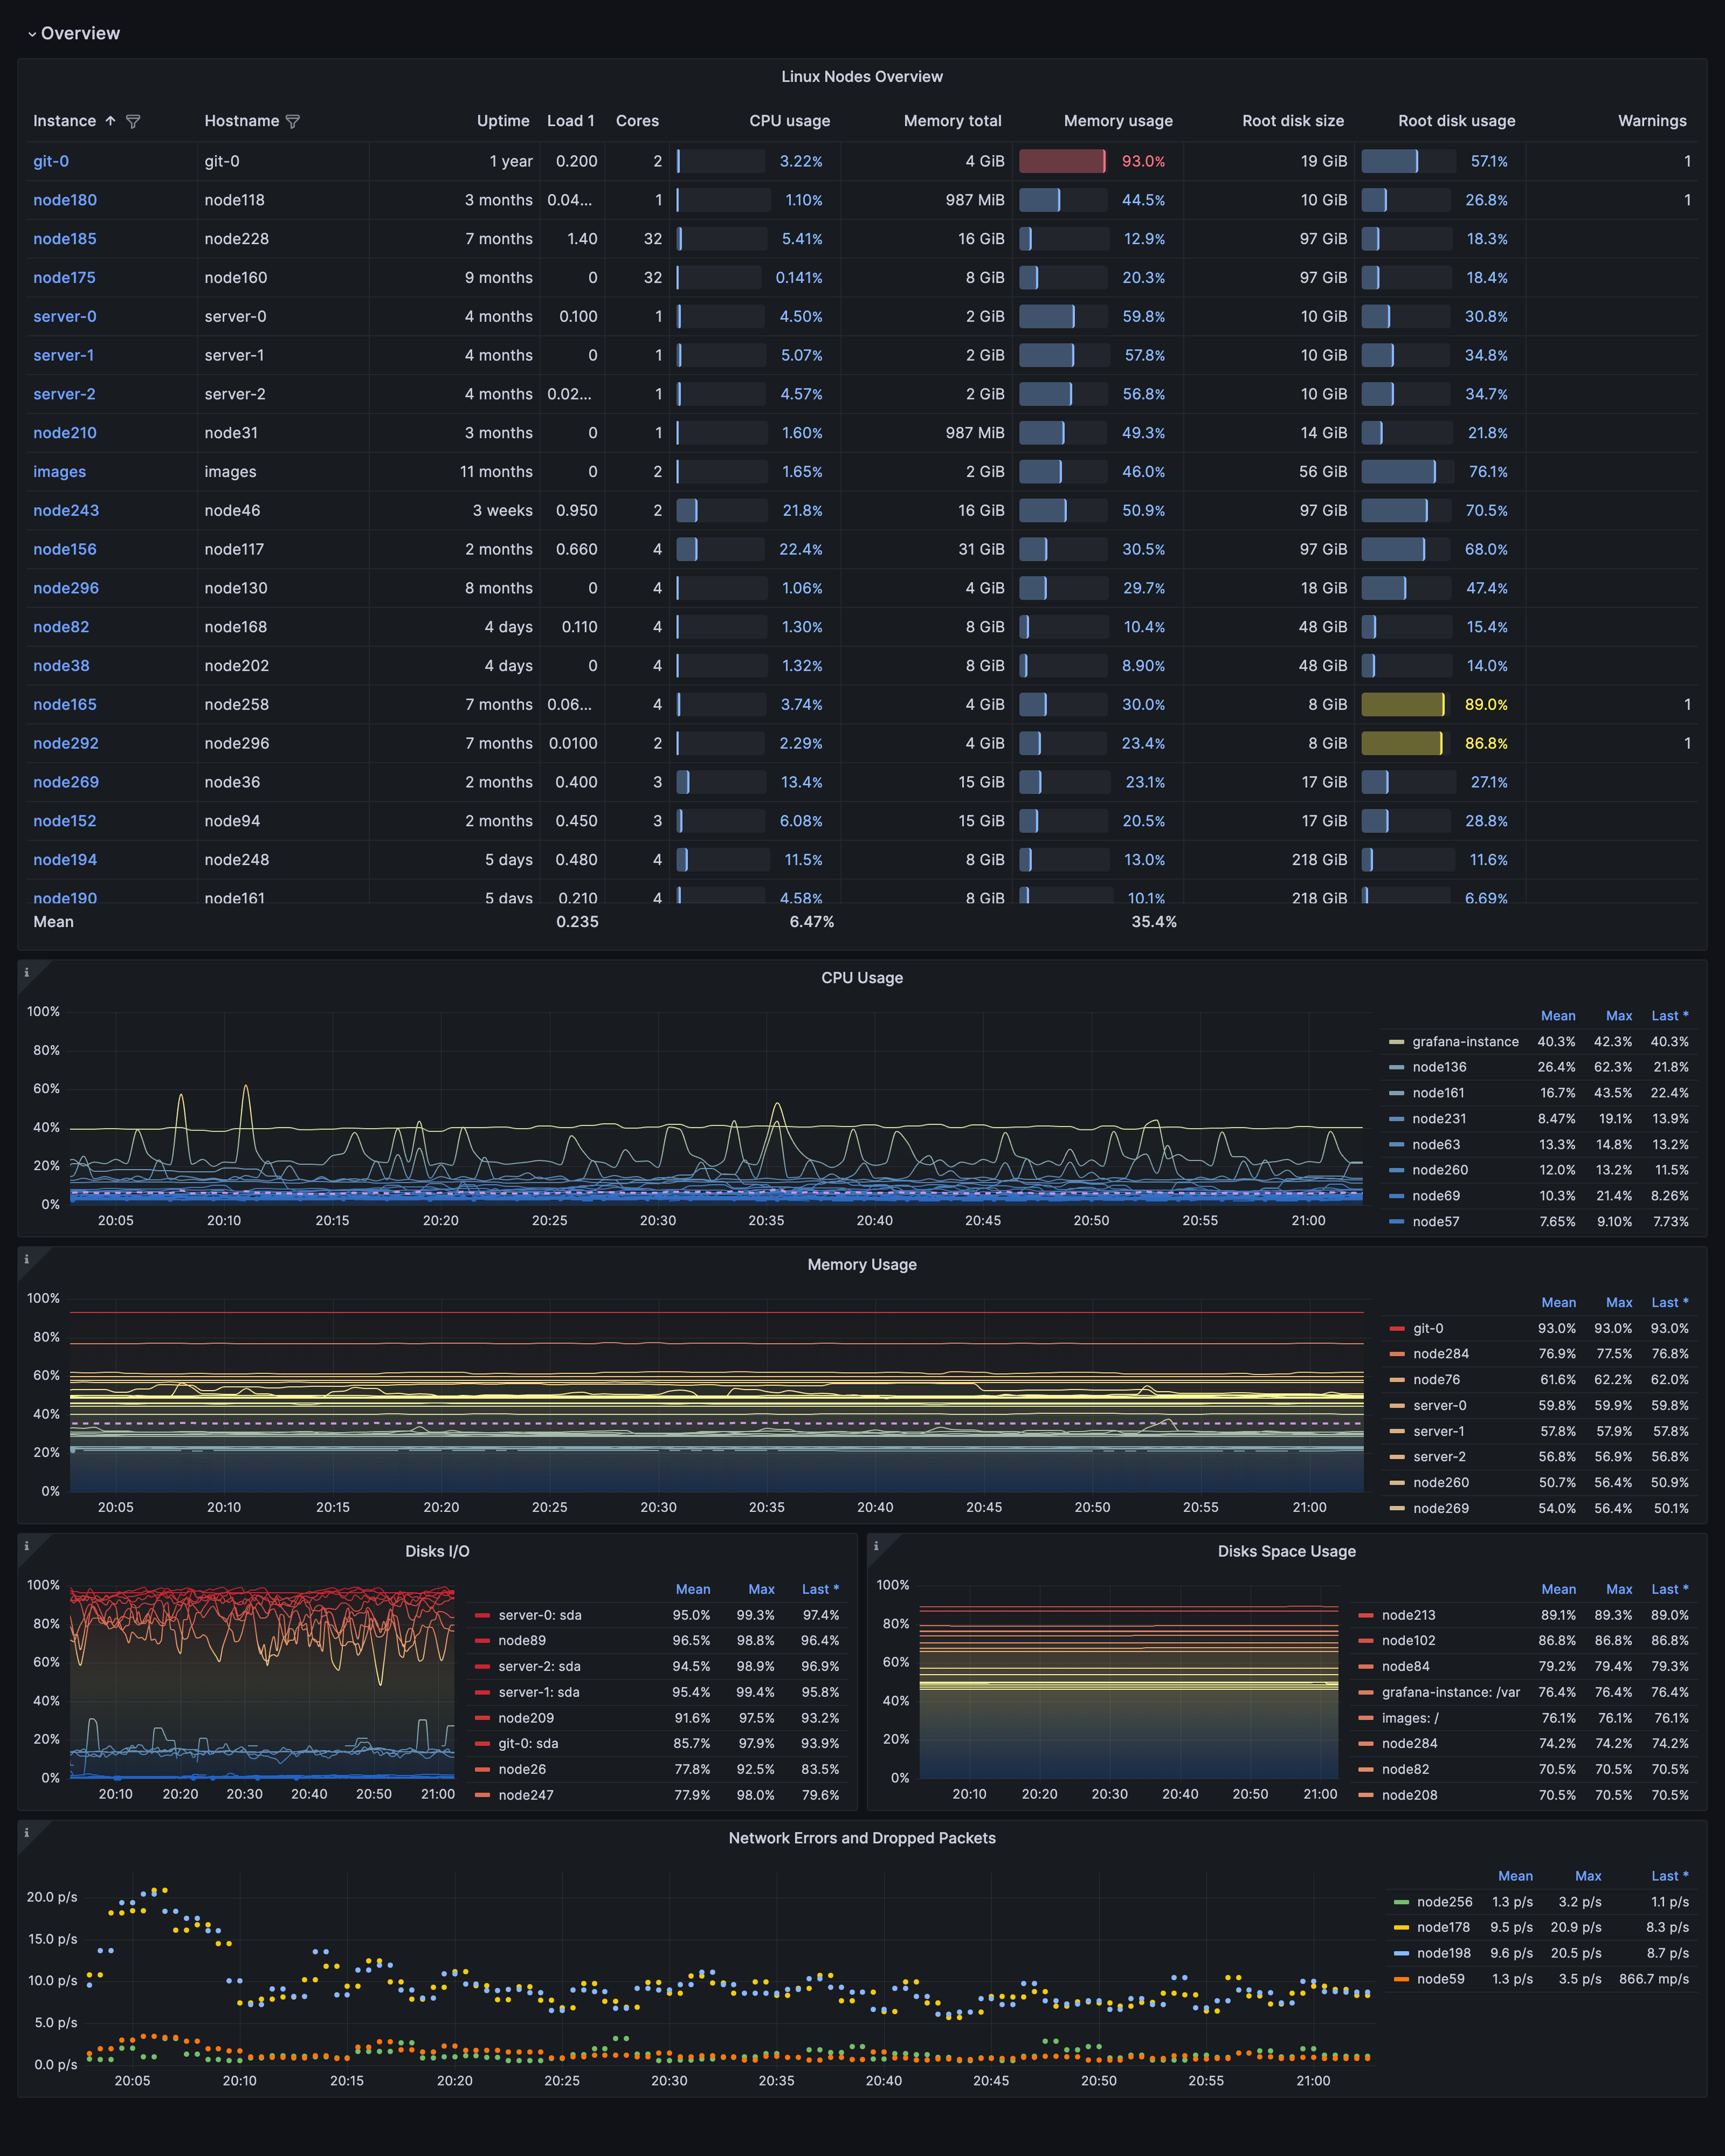
Prerequisites
- Linux host (any distribution)
- Prometheus or Grafana Alloy running and able to reach the host
- xScaler tenant credentials (token + tenant ID)
Step 1: Install node_exporter
systemd (recommended)
# Download latest release
curl -LO https://github.com/prometheus/node_exporter/releases/latest/download/node_exporter-1.8.2.linux-amd64.tar.gz
tar xzf node_exporter-1.8.2.linux-amd64.tar.gz
sudo mv node_exporter-1.8.2.linux-amd64/node_exporter /usr/local/bin/

# Create systemd service
sudo tee /etc/systemd/system/node_exporter.service > /dev/null <<EOF
[Unit]
Description=Prometheus node_exporter
After=network.target

[Service]
Type=simple
User=nobody
ExecStart=/usr/local/bin/node_exporter
Restart=on-failure

[Install]
WantedBy=multi-user.target
EOF

sudo systemctl daemon-reload
sudo systemctl enable --now node_exporter
Verify it's running:
curl -s http://localhost:9100/metrics | head -5
Step 2: Scrape and forward to xScaler
Option A: Prometheus
Add to prometheus.yml:
scrape_configs:
  - job_name: linux
    static_configs:
      - targets: ['localhost:9100']
        labels:
          host: my-server

remote_write:
  - url: https://euw1-01.m.xscalerlabs.com/api/v1/push
    authorization:
      credentials: <token>
    headers:
      X-Scope-OrgID: <tenant-id>
Option B: Grafana Alloy
prometheus.exporter.unix "host" {}

prometheus.scrape "linux" {
  targets        = prometheus.exporter.unix.host.targets
  forward_to     = [prometheus.remote_write.xscaler.receiver]
  scrape_interval = "15s"
}

prometheus.remote_write "xscaler" {
  endpoint {
    url = "https://euw1-01.m.xscalerlabs.com/api/v1/push"
    authorization {
      type        = "Bearer"
      credentials = "<token>"
    }
    headers = { "X-Scope-OrgID" = "<tenant-id>" }
  }
}
tip
The prometheus.exporter.unix component in Alloy is a built-in wrapper around node_exporter. No separate binary needed.
Option C: OpenTelemetry Collector
receivers:
  hostmetrics:
    collection_interval: 15s
    scrapers:
      cpu: {}
      disk: {}
      filesystem: {}
      load: {}
      memory: {}
      network: {}
      paging: {}
      processes: {}

processors:
  memory_limiter:
    check_interval: 1s
    limit_mib: 256
  batch:
    timeout: 10s

exporters:
  otlphttp/xscaler:
    endpoint: https://euw1-01.m.xscalerlabs.com
    headers:
      Authorization: "Bearer <token>"
      X-Scope-OrgID: "<tenant-id>"

service:
  pipelines:
    metrics:
      receivers:  [hostmetrics]
      processors: [memory_limiter, batch]
      exporters:  [otlphttp/xscaler]
Logs
Collect syslog, auth, kernel, and all .log files under /var/log/. Add the following to your Alloy config:
loki.source.journal "linux_journal" {
  forward_to    = [loki.write.xscaler.receiver]
  relabel_rules = loki.relabel.linux_journal.rules
  labels = {
    job      = "integrations/node_exporter",
    instance = constants.hostname,
  }
}

loki.relabel "linux_journal" {
  forward_to = []
  rule {
    source_labels = ["__journal__systemd_unit"]
    target_label  = "unit"
  }
}

local.file_match "linux_files" {
  path_targets = [{
    __address__ = "localhost",
    __path__    = "/var/log/{syslog,messages,*.log}",
    instance    = constants.hostname,
    job         = "integrations/node_exporter",
  }]
}

loki.source.file "linux_files" {
  targets    = local.file_match.linux_files.targets
  forward_to = [loki.write.xscaler.receiver]
}

loki.write "xscaler" {
  endpoint {
    url = "https://euw1-01.l.xscalerlabs.com/api/v1/push"

    http_client_config {
      authorization {
        type        = "Bearer"
        credentials = env("XSCALER_TOKEN")
      }
    }

    headers = { "X-Scope-OrgID" = env("XSCALER_TENANT_ID") }
  }
}
Key metrics
| Metric | Description |
|---|---|
node_cpu_seconds_total | CPU time by mode (idle, user, system, iowait) |
node_memory_MemAvailable_bytes | Available memory |
node_memory_MemTotal_bytes | Total memory |
node_disk_read_bytes_total | Bytes read from disk |
node_disk_written_bytes_total | Bytes written to disk |
node_filesystem_avail_bytes | Available filesystem space |
node_filesystem_size_bytes | Total filesystem size |
node_network_receive_bytes_total | Network bytes received |
node_network_transmit_bytes_total | Network bytes transmitted |
node_load1 | 1-minute load average |
node_load5 | 5-minute load average |
Useful PromQL queries
# CPU usage % (all cores)
100 - avg(rate(node_cpu_seconds_total{mode="idle"}[5m])) * 100

# Memory usage %
(1 - node_memory_MemAvailable_bytes / node_memory_MemTotal_bytes) * 100

# Disk usage % per mount
(1 - node_filesystem_avail_bytes / node_filesystem_size_bytes) * 100

# Network receive rate (bytes/sec)
rate(node_network_receive_bytes_total[5m])

# Disk I/O wait
rate(node_cpu_seconds_total{mode="iowait"}[5m])
Troubleshooting
No metrics appearing
- Confirm node_exporter is running:
systemctl status node_exporter - Check Prometheus scrape errors:
prometheus_target_scrape_sample_count{job="linux"} - Verify
remote_writeURL ends in/api/v1/pushand both auth headers are set