Elasticsearch
Monitor Elasticsearch cluster health, indexing throughput, search latency, and JVM performance.
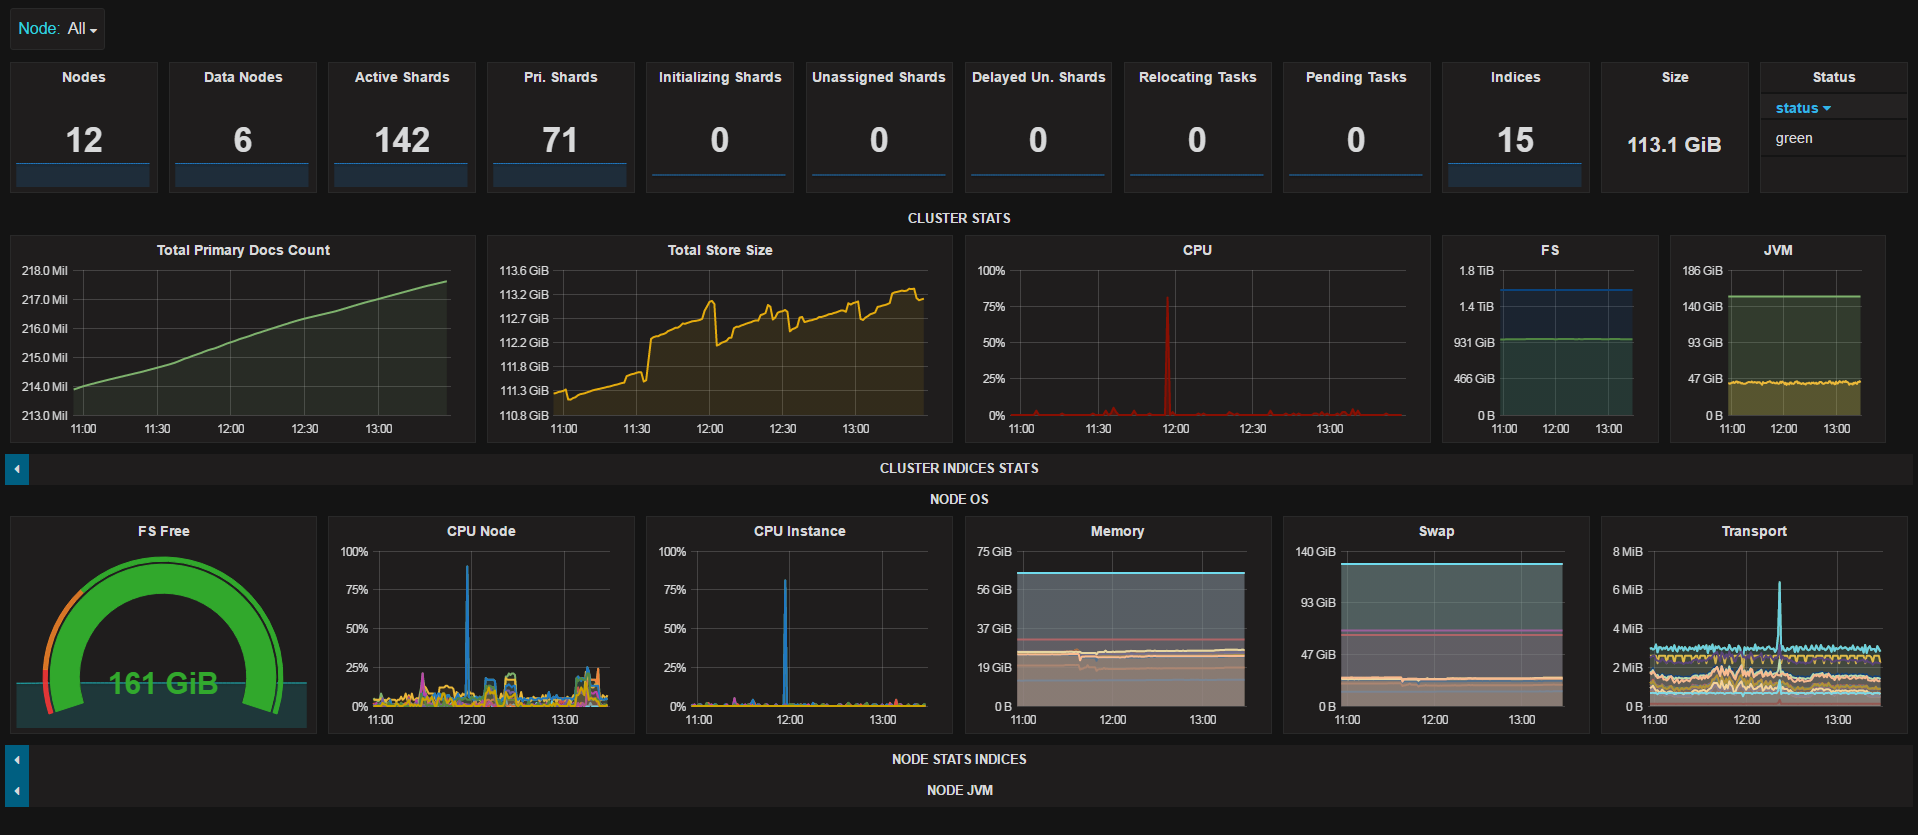
Key metrics
| Metric | Description |
|---|---|
elasticsearch_cluster_health_status | Cluster health (0=green, 1=yellow, 2=red) |
elasticsearch_indices_docs | Total document count |
elasticsearch_jvm_memory_used_bytes | JVM heap in use |
elasticsearch_indices_search_query_total | Cumulative search queries |
elasticsearch_indices_indexing_index_total | Cumulative index operations |
elasticsearch_os_cpu_percent | OS CPU usage |
Prerequisites
- Elasticsearch 7.x or 8.x
- Network access to port
9200
Configuration
Option A: Prometheus Exporter
docker run -d \
  -p 9114:9114 \
  --name elasticsearch_exporter \
  quay.io/prometheuscommunity/elasticsearch-exporter:latest \
  --es.uri=http://localhost:9200
scrape_configs:
  - job_name: elasticsearch
    static_configs:
      - targets: ['localhost:9114']

remote_write:
  - url: https://<region>.xscalerlabs.com/api/v1/push
    headers:
      X-Scope-OrgID: <tenant-id>
    basic_auth:
      password: <api-token>
Option B: Grafana Alloy
prometheus.scrape "elasticsearch" {
  targets = [{"__address__" = "localhost:9114"}]
  forward_to = [prometheus.remote_write.xscaler.receiver]
}

prometheus.remote_write "xscaler" {
  endpoint {
    url = "https://<region>.xscalerlabs.com/api/v1/push"
    headers = { "X-Scope-OrgID" = "<tenant-id>" }
    basic_auth { password = "<api-token>" }
  }
}
Option C: OpenTelemetry Collector
receivers:
  elasticsearch:
    hosts:
      - http://localhost:9200
    collection_interval: 60s

exporters:
  prometheusremotewrite:
    endpoint: https://<region>.xscalerlabs.com/api/v1/push
    headers:
      Authorization: Bearer <api-token>
      X-Scope-OrgID: <tenant-id>

service:
  pipelines:
    metrics:
      receivers: [elasticsearch]
      exporters: [prometheusremotewrite]
Logs
Collect Elasticsearch server, slow search/index, and GC logs. Add the following to your Alloy config:
local.file_match "elasticsearch_logs" {
  path_targets = [{
    __address__ = "localhost",
    __path__    = "/var/log/elasticsearch/*.log",
    instance    = constants.hostname,
    job         = "integrations/elasticsearch",
  }]
}

loki.source.file "elasticsearch_logs" {
  targets    = local.file_match.elasticsearch_logs.targets
  forward_to = [loki.write.xscaler.receiver]
}

loki.write "xscaler" {
  endpoint {
    url = "https://euw1-01.l.xscalerlabs.com/api/v1/push"

    http_client_config {
      authorization {
        type        = "Bearer"
        credentials = env("XSCALER_TOKEN")
      }
    }

    headers = { "X-Scope-OrgID" = env("XSCALER_TENANT_ID") }
  }
}