Docker
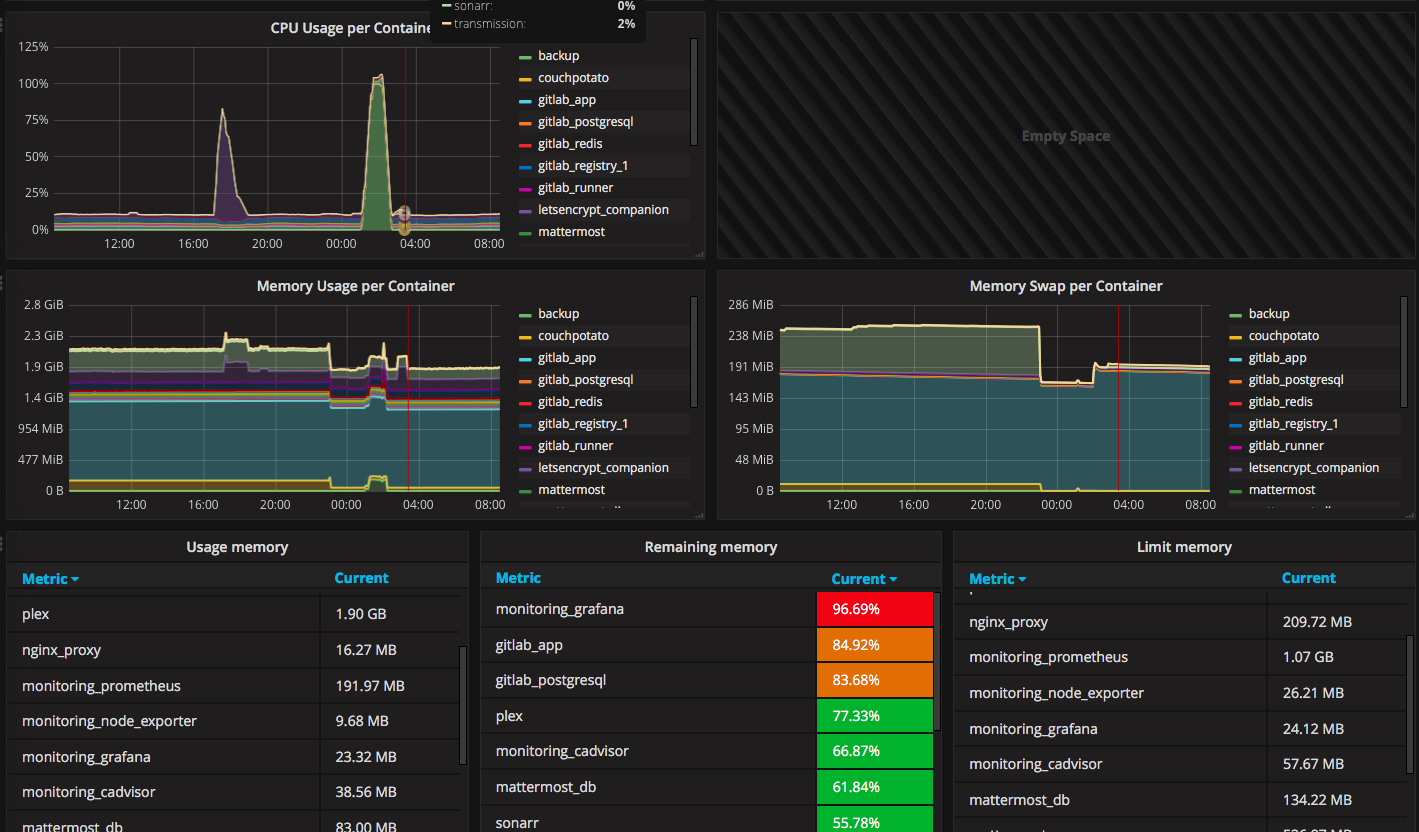
Collect container-level metrics from a Docker host using the OpenTelemetry Collector's Docker Stats receiver: CPU, memory, network I/O, and block I/O per container.
Pattern: OTel Collector docker_stats receiver → xScaler OTLP endpoint
Dashboard
Prerequisites
- Docker Engine running on the host
- OTel Collector deployed on the same host (or with access to the Docker socket)
- xScaler tenant credentials
Configuration
Save as otel-collector-config.yaml:
receivers:
  docker_stats:
    endpoint: unix:///var/run/docker.sock
    collection_interval: 15s
    timeout: 20s
    api_version: "1.24"

processors:
  memory_limiter:
    check_interval: 1s
    limit_mib: 256
  batch:
    timeout: 10s
    send_batch_size: 1000
  resourcedetection:
    detectors: [env, system, docker]
    timeout: 5s

exporters:
  otlphttp/xscaler:
    endpoint: https://euw1-01.m.xscalerlabs.com
    headers:
      Authorization: "Bearer <token>"
      X-Scope-OrgID: "<tenant-id>"
    compression: gzip

service:
  pipelines:
    metrics:
      receivers:  [docker_stats]
      processors: [memory_limiter, resourcedetection, batch]
      exporters:  [otlphttp/xscaler]
Run the collector
docker run --rm \
  -v /var/run/docker.sock:/var/run/docker.sock:ro \
  -v $(pwd)/otel-collector-config.yaml:/etc/otelcol-contrib/config.yaml \
  otel/opentelemetry-collector-contrib:latest
Docker socket access
The collector needs read access to /var/run/docker.sock to query container stats. The :ro flag mounts it read-only.
Grafana Alloy
discovery.docker "containers" {
  host = "unix:///var/run/docker.sock"
}

prometheus.scrape "docker" {
  targets    = discovery.docker.containers.targets
  forward_to = [prometheus.remote_write.xscaler.receiver]
  scrape_interval = "15s"
}

prometheus.remote_write "xscaler" {
  endpoint {
    url = "https://euw1-01.m.xscalerlabs.com/api/v1/push"
    authorization {
      type        = "Bearer"
      credentials = "<token>"
    }
    headers = { "X-Scope-OrgID" = "<tenant-id>" }
  }
}
Logs
Collect stdout and stderr from all running containers. Add the following to your Alloy config:
discovery.docker "docker_containers" {
  host = "unix:///var/run/docker.sock"
}

discovery.relabel "docker_logs" {
  targets = discovery.docker.docker_containers.targets
  rule {
    source_labels = ["__meta_docker_container_name"]
    regex         = "/(.*)"
    target_label  = "container"
  }
  rule {
    replacement  = "integrations/docker"
    target_label = "job"
  }
}

loki.source.docker "docker_logs" {
  host       = "unix:///var/run/docker.sock"
  targets    = discovery.relabel.docker_logs.output
  forward_to = [loki.write.xscaler.receiver]
  labels     = { instance = constants.hostname }
}

loki.write "xscaler" {
  endpoint {
    url = "https://euw1-01.l.xscalerlabs.com/api/v1/push"

    http_client_config {
      authorization {
        type        = "Bearer"
        credentials = env("XSCALER_TOKEN")
      }
    }

    headers = { "X-Scope-OrgID" = env("XSCALER_TENANT_ID") }
  }
}
Key metrics
| Metric | Description |
|---|---|
container.cpu.usage.total | Total CPU usage in nanoseconds |
container.cpu.percent | CPU usage as a percentage of available cores |
container.memory.usage.total | Total memory usage in bytes |
container.memory.percent | Memory usage as a percentage of the limit |
container.blockio.io_service_bytes_recursive | Block I/O bytes read/written |
container.network.io.usage.rx_bytes | Network bytes received |
container.network.io.usage.tx_bytes | Network bytes transmitted |
Useful PromQL queries
# CPU usage % per container
rate(container_cpu_usage_seconds_total[5m]) * 100

# Memory usage per container (bytes)
container_memory_usage_bytes

# Network receive rate per container
rate(container_network_receive_bytes_total[5m])

# Top 10 containers by memory
topk(10, container_memory_usage_bytes)