AWS CloudWatch
Pull metrics from AWS CloudWatch into xScaler using the OpenTelemetry Collector's awscloudwatch receiver. Covers EC2, RDS, Lambda, ELB, S3, SQS, and any other CloudWatch namespace.
Pattern: OTel Collector awscloudwatch receiver → xScaler OTLP endpoint
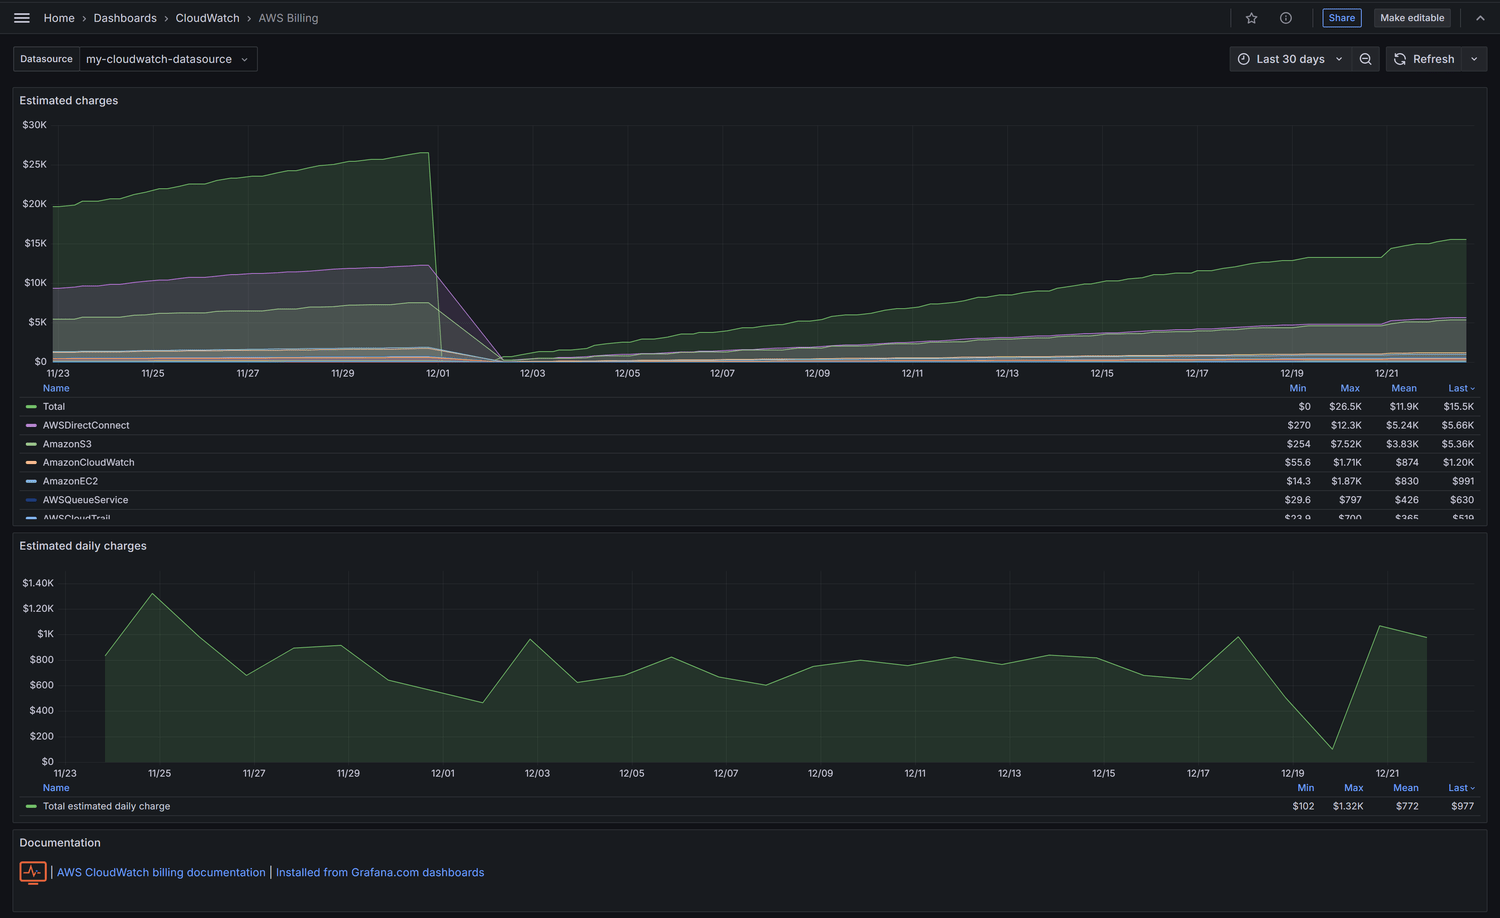
Dashboard
Prerequisites
- AWS account with CloudWatch metrics
- IAM credentials with
cloudwatch:GetMetricDataandcloudwatch:ListMetricspermissions - OTel Collector (contrib distribution)
- xScaler tenant credentials
IAM policy
Attach this policy to the IAM user or role used by the collector:
{
  "Version": "2012-10-17",
  "Statement": [
    {
      "Effect": "Allow",
      "Action": [
        "cloudwatch:GetMetricData",
        "cloudwatch:ListMetrics"
      ],
      "Resource": "*"
    }
  ]
}
Configuration
Save as otel-collector-config.yaml:
receivers:
  awscloudwatch:
    region: eu-west-1
    poll_interval: 1m
    metrics:
      named:
        # EC2
        AWS/EC2:
          dimensions:
            - [InstanceId]
          metrics:
            - name: CPUUtilization
              period: 60
              stat: Average
            - name: NetworkIn
              period: 60
              stat: Sum
            - name: NetworkOut
              period: 60
              stat: Sum

        # RDS
        AWS/RDS:
          dimensions:
            - [DBInstanceIdentifier]
          metrics:
            - name: CPUUtilization
              period: 60
              stat: Average
            - name: DatabaseConnections
              period: 60
              stat: Average
            - name: FreeStorageSpace
              period: 60
              stat: Average

        # Lambda
        AWS/Lambda:
          dimensions:
            - [FunctionName]
          metrics:
            - name: Duration
              period: 60
              stat: Average
            - name: Errors
              period: 60
              stat: Sum
            - name: Invocations
              period: 60
              stat: Sum
            - name: Throttles
              period: 60
              stat: Sum

        # ALB
        AWS/ApplicationELB:
          dimensions:
            - [LoadBalancer]
          metrics:
            - name: RequestCount
              period: 60
              stat: Sum
            - name: TargetResponseTime
              period: 60
              stat: Average
            - name: HTTPCode_ELB_5XX_Count
              period: 60
              stat: Sum

processors:
  memory_limiter:
    check_interval: 1s
    limit_mib: 512
  batch:
    timeout: 30s
    send_batch_size: 1000

exporters:
  otlphttp/xscaler:
    endpoint: https://euw1-01.m.xscalerlabs.com
    headers:
      Authorization: "Bearer <token>"
      X-Scope-OrgID: "<tenant-id>"
    compression: gzip

service:
  pipelines:
    metrics:
      receivers:  [awscloudwatch]
      processors: [memory_limiter, batch]
      exporters:  [otlphttp/xscaler]
Provide AWS credentials
Option A: Environment variables (recommended for local/Docker)
export AWS_ACCESS_KEY_ID=AKIA...
export AWS_SECRET_ACCESS_KEY=...
export AWS_REGION=eu-west-1
Option B: IAM instance role (recommended for EC2/ECS)
Attach the IAM policy to the EC2 instance profile or ECS task role. The collector picks up credentials automatically via the EC2 metadata endpoint.
Logs
CloudWatch Logs. Stream log groups to xScaler using the CloudWatch Logs subscription filter or Kinesis Firehose with an OTel Collector forwarder.
Key metrics
| AWS Service | Metric | Description |
|---|---|---|
| EC2 | CPUUtilization | Instance CPU % |
| EC2 | NetworkIn / NetworkOut | Bytes in/out |
| RDS | CPUUtilization | Database CPU % |
| RDS | DatabaseConnections | Active connections |
| RDS | FreeStorageSpace | Available disk |
| Lambda | Invocations | Function call count |
| Lambda | Errors | Failed invocations |
| Lambda | Duration | Execution time (ms) |
| Lambda | Throttles | Throttled invocations |
| ALB | RequestCount | Total requests |
| ALB | TargetResponseTime | Latency (s) |
| ALB | HTTPCode_ELB_5XX_Count | 5xx errors |
Useful PromQL queries
# EC2 average CPU across all instances
avg(aws_ec2_cpu_utilization_average)

# Lambda error rate %
sum(aws_lambda_errors_sum) / sum(aws_lambda_invocations_sum) * 100

# RDS connections by instance
aws_rds_database_connections_average

# ALB 5xx error rate
rate(aws_applicationelb_h_t_t_p_code_elb_5_x_x_count_sum[5m])
Troubleshooting
NoCredentialProviders
AWS credentials are not reachable. Set AWS_ACCESS_KEY_ID and AWS_SECRET_ACCESS_KEY env vars, or verify the instance profile is attached.
Empty results from CloudWatch
CloudWatch metrics lag by up to 5 minutes. Increase poll_interval to 5m to avoid redundant API calls and reduce cost.