Connect Grafana Datasources
Connect Grafana to xScaler metrics, logs, and traces as native Prometheus, Loki, and Tempo datasources. Once connected you can query, correlate, and alert across all signals from a single Grafana instance.
Works with Grafana 9.1+. Both self-hosted and Grafana Cloud.
Before you start
You need the following from the xScaler portal for each tenant you want to query:
| Item | Where to find it |
|---|---|
| API token | Organization → Tenants → tenant name → API keys |
| Tenant ID | Shown in the tenant list and on the tenant detail page |
| Region endpoints | See Regions & Endpoints |
For the euw1-01 region:
| Signal | Query endpoint |
|---|---|
| Metrics | https://euw1-01.m.xscalerlabs.com |
| Logs | https://euw1-01.l.xscalerlabs.com |
| Traces | https://euw1-01.t.xscalerlabs.com |
A single API token works for all three signals as long as it is scoped for read access. Create it once and reuse it across all datasource configs.
Metrics: Prometheus datasource
Step 1: Add a new connection
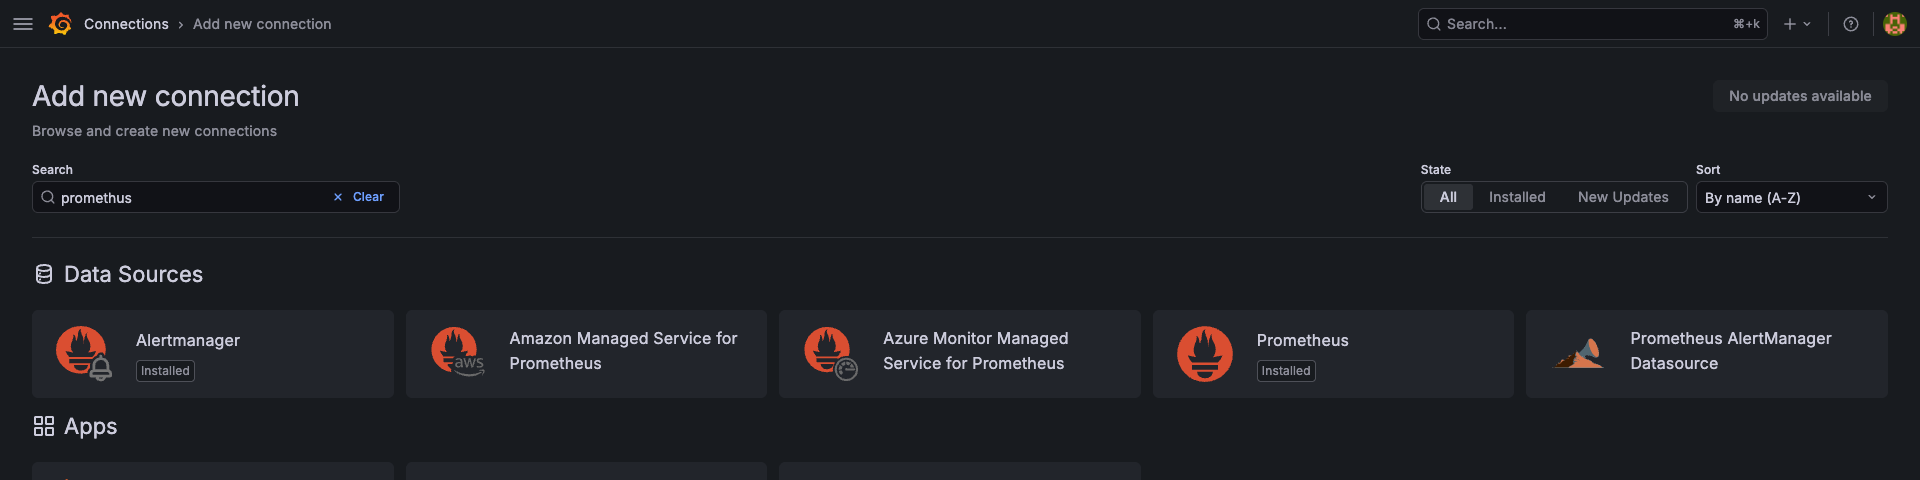
In Grafana, go to Connections → Add new connection. Search for Prometheus and click the Prometheus card.
Step 2: Set the server URL
In the Prometheus server URL field enter the metrics endpoint for your region:
https://euw1-01.m.xscalerlabs.com

Enter the host root only. Grafana appends /api/v1/query automatically. Do not add any path.
Step 3: Add HTTP headers
Scroll down to the HTTP Headers section and add two headers:
| Header | Value |
|---|---|
Authorization | Bearer <your-api-token> |
X-Scope-OrgID | <your-tenant-id> |

Do not use the Basic Auth fields or the Grafana Authentication section. xScaler accepts Bearer tokens in custom HTTP headers only.
Step 4: Save & test
Click Save & test. A successful response shows:
Successfully queried the Prometheus API.

Logs: Loki datasource
Step 1: Add a new connection
In Grafana, go to Connections → Add new connection. Search for Loki and click the Loki card.

Step 2: Set the URL
In the URL field enter the logs endpoint:
https://euw1-01.l.xscalerlabs.com

Step 3: Add HTTP headers
Scroll to HTTP Headers and add:
| Header | Value |
|---|---|
Authorization | Bearer <your-api-token> |
X-Scope-OrgID | <your-tenant-id> |

Step 4: Save & test
Click Save & test. A successful response shows:
Data source successfully connected.

If the connection succeeds but queries come back empty, no logs have arrived for this tenant yet. Send logs first using Grafana Alloy or the OTel Collector.
Traces: Tempo datasource
Step 1: Add a new connection
In Grafana, go to Connections → Add new connection. Search for Tempo and click the Tempo card.

Step 2: Set the URL
In the URL field enter the traces endpoint:
https://euw1-01.t.xscalerlabs.com

Step 3: Add HTTP headers
Scroll to HTTP Headers and add:
| Header | Value |
|---|---|
Authorization | Bearer <your-api-token> |
X-Scope-OrgID | <your-tenant-id> |

Step 4: Save & test
Click Save & test. A successful response shows:
Data source is working

Link signals together
With all three datasources connected, configure Grafana to jump between signals automatically.
Trace to logs
In the Tempo datasource settings scroll to Trace to logs:
| Field | Value |
|---|---|
| Data source | Your Loki datasource |
| Tags | service.name |
| Filter by trace ID | Enabled |
This adds a Logs button on every span view that jumps to the correlated log lines for the same service and time window.
Trace to metrics
In the Tempo datasource settings scroll to Trace to metrics:
| Field | Value |
|---|---|
| Data source | Your Prometheus datasource |
| Query | rate(traces_spanmetrics_duration_bucket{service="${__span.tags.service.name}"}[$__rate_interval]) |
Metrics to logs (Correlations)
- Go to Administration → Correlations.
- Click Add correlation.
- Set Source to your Prometheus datasource.
- Set Target to your Loki datasource.
- Use
{job="${job}"}as the target query and map thejoblabel from the metric series.
Verify all three in Explore
Open Explore to confirm each signal works end-to-end.
Metrics. Select the Prometheus datasource and run:
up
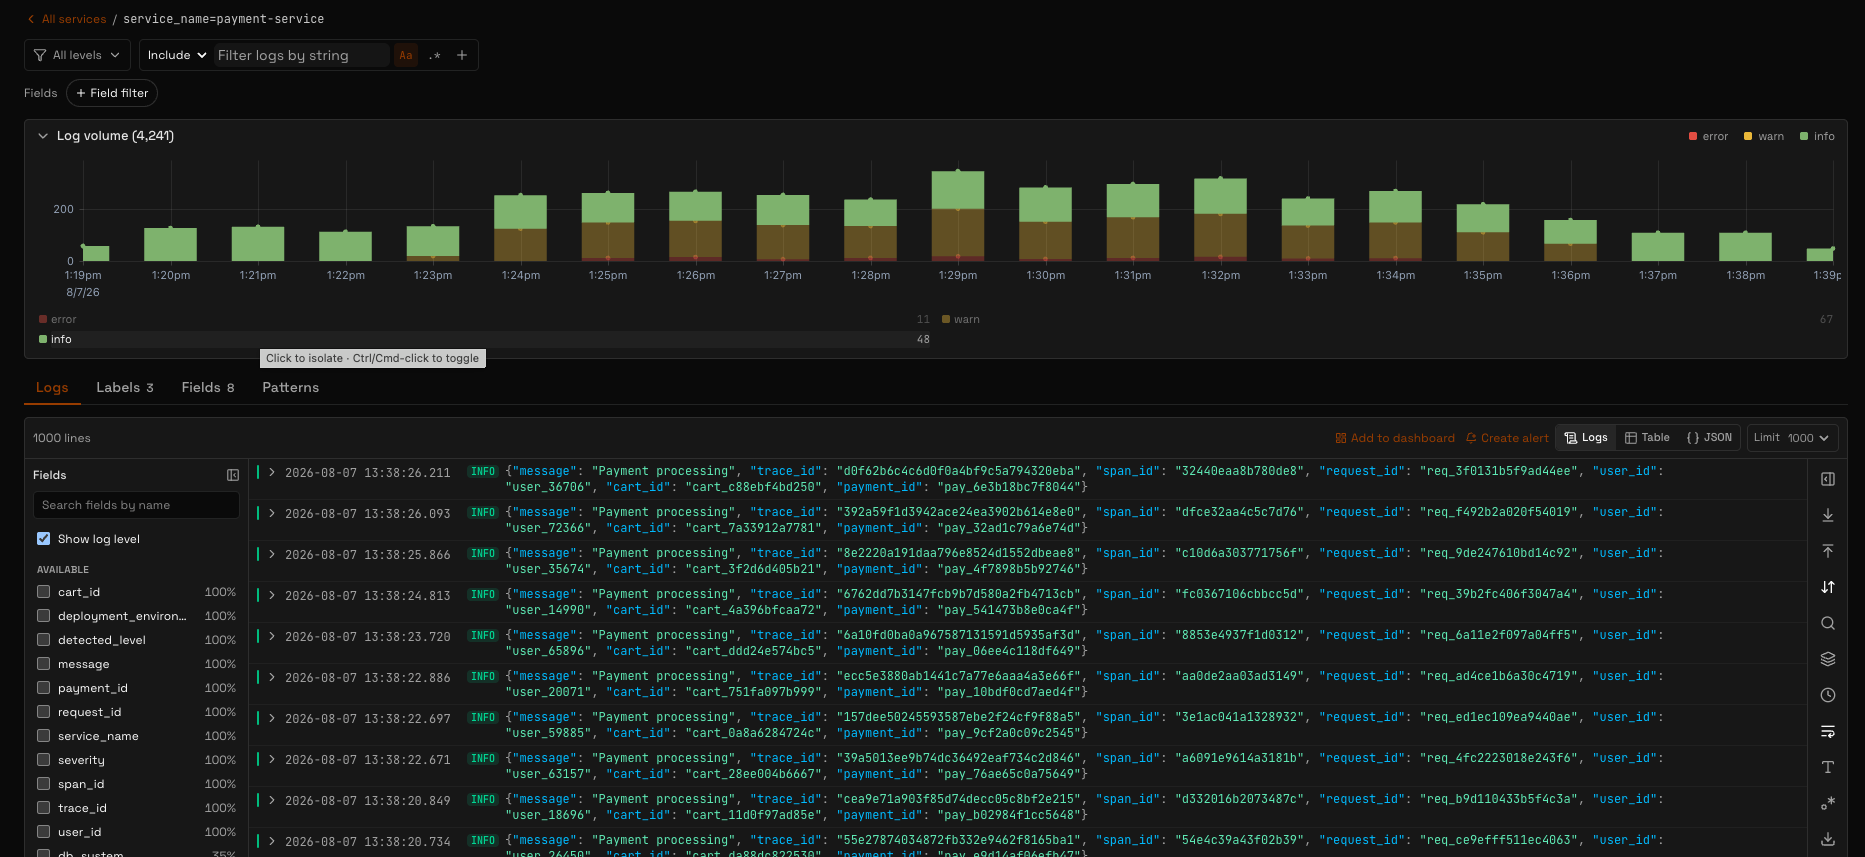
Logs. Select the Loki datasource and run:
{job=~".+"}
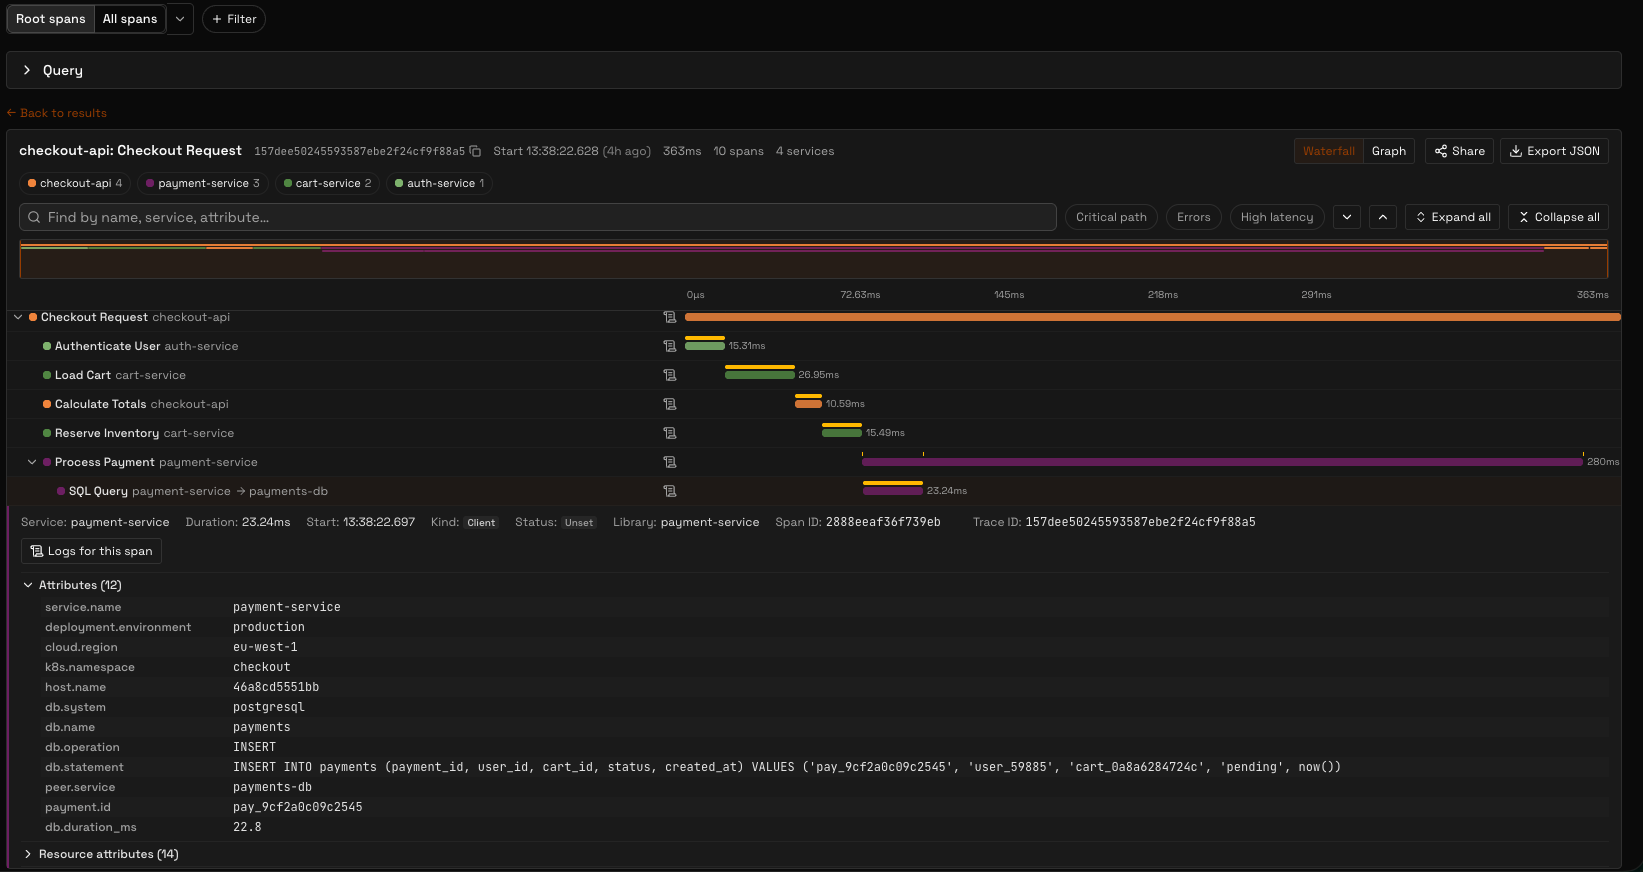
Traces. Select the Tempo datasource, switch to the Search tab, and click Run query with no filters.
Troubleshooting
"Bad Gateway" on Save & Test
- Verify the URL is the host root only (e.g.
https://euw1-01.m.xscalerlabs.com) with no path suffix and no trailing slash. - Confirm HTTPS. HTTP is not accepted.
"Forbidden" (403) on Save & Test
- The token may be
write-only. Generate areadorread+writetoken: go to Organization → Tenants → tenant name → API keys in the portal and create a new key.
401 Unauthorized
- The
Authorizationheader value must be exactlyBearer <token>: capital B, one space, then the raw token. - Check that the header is in the HTTP Headers section, not in the Grafana Authentication panel.
"No org id" error in queries
- The
X-Scope-OrgIDheader is missing. Add it to the HTTP Headers section of the datasource config.
Loki: "Data source connected" but no labels
- No logs have been ingested yet for this tenant.
- The label browser only shows labels active in the selected time range. Widen the time picker.
Tempo: No traces found
- Use the Search tab with a wide time range and no service filter to confirm traces exist.
- Check the time range. It must cover the period when traces were sent.